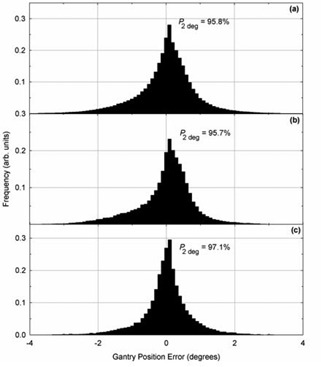
Figure 5. Histograms of gantry position errors for: (a) all patients, (b) patients receiving irradiation of the prostatic volume only, and (c) patients receiving postmastectomy chest wall irradiation. The quantity represents the percentage of gantry positions within 2° of their planned position.

