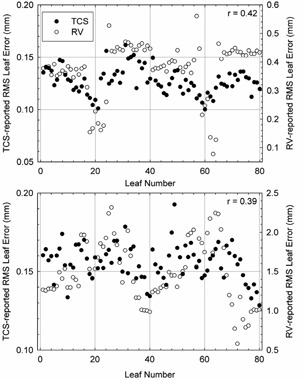
Figure 8. Average MLC leaf errors as reported by the RV‐based delivery verification system (open circles, right axis) and the treatment control system (filled circles, left axis) for a prostate (top) and a chest wall (bottom) fraction. The Pearson product‐moment correlation coefficient (r) for each paired dataset is also shown.

