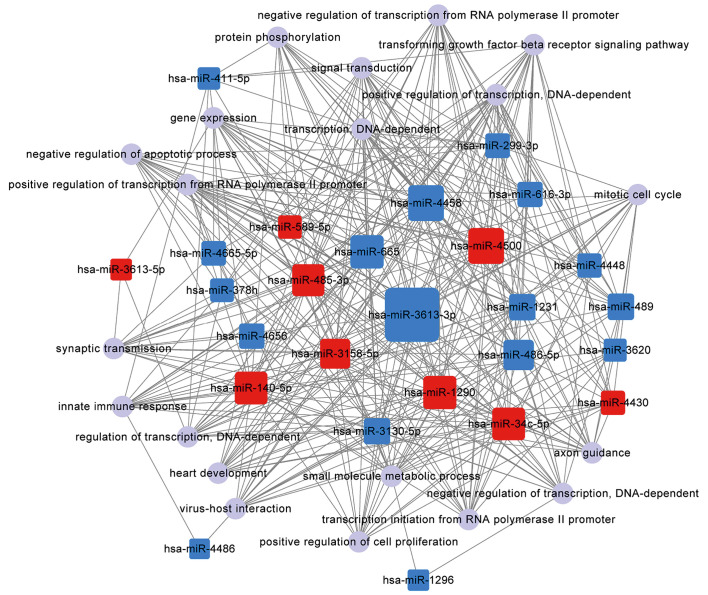
Figure 5.
Interaction between the top 20 targeted functions and the differentially expressed microRNAs (miRNAs). The red square nodes represent upregulated miRNAs, the blue square nodes represent downregulated miRNAs, and the violet circular nodes represent target functions. The lines represent the inhibitory effect of miRNAs on target functions. The size of square nodes indicates the degree to which the miRNAs contribute to the network.

