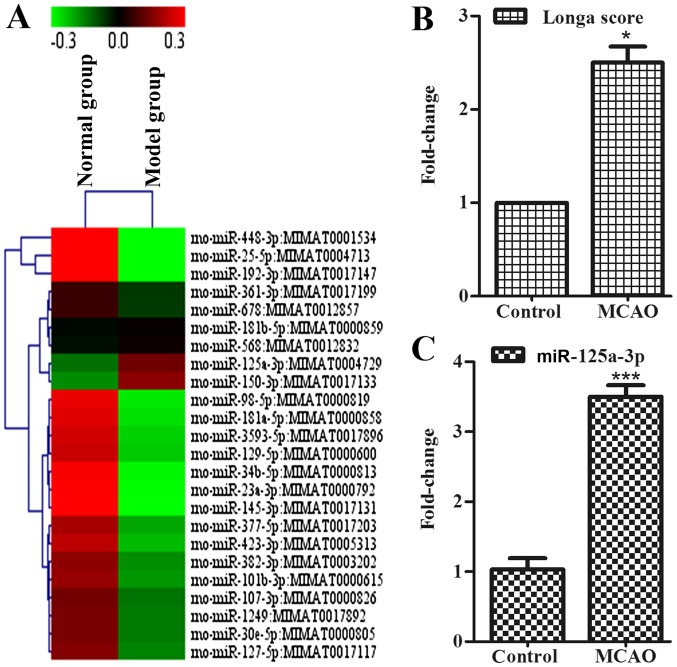
Figure 1.
miR-125a was increased in the cortex of ischemic rats. (A) The expression of miRNAs in cortex was measured using microarray analysis in control group (left) and model group (right). (B) Longa score in control group and model group. (C) The expression of miR-125a in cortex were measured using reverse transcription-quantitative polymerase chain reaction in the cortex, data were presented as the mean ± standard deviation, n=3 in each group. *P<0.05 vs. normal group. miR, microRNA; MCAO, middle cerebral artery occlusion; Cadm2, cell adhesion molecule 2.

