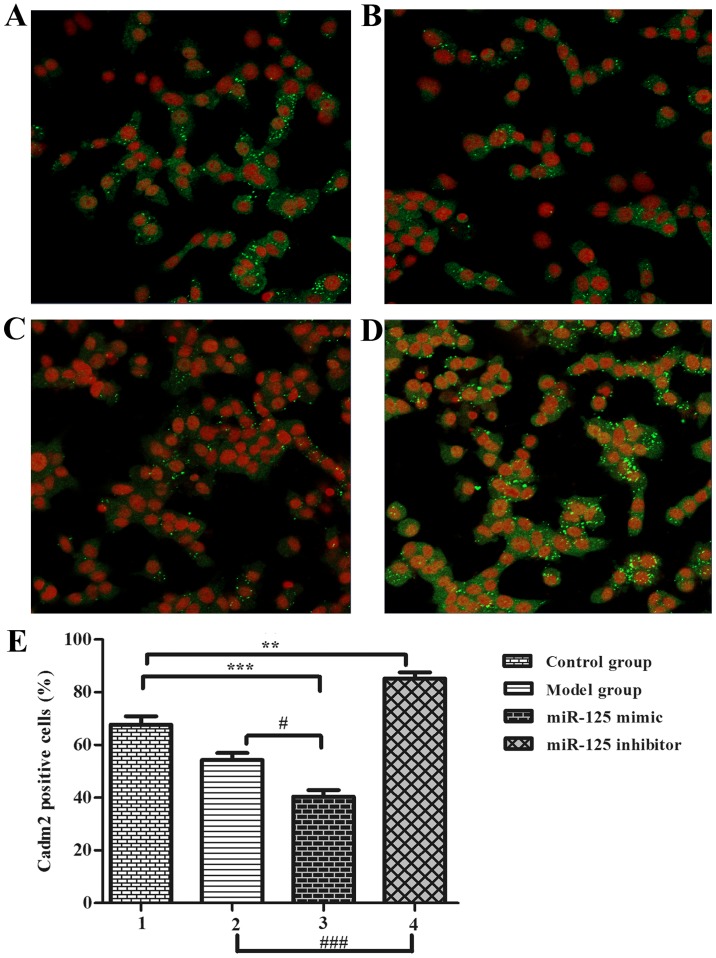
Figure 3.
miR-125a inhibited Cadm2 expression (original magnification, ×200). (A) Control group, (B) model group (serum-free), (C) miR-125a mimic group, (D) miR-125a inhibitor group. (E) Percentage of Cadm2-positive cells. One-way analysis of variance was used to analyze the differences. **P<0.01 and ***P<0.001; #P<0.05 and ###P<0.001 as indicated. miR, microRNA. Cadm2, cell adhesion molecule 2.

