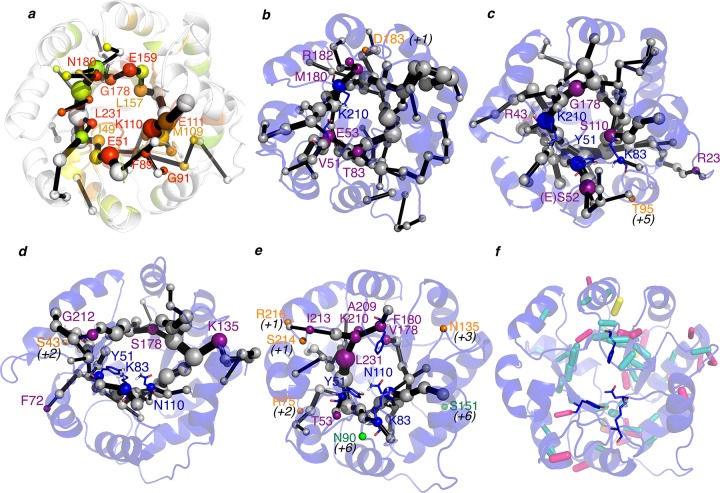
Figure 4.
Representation of the shortest path map (SPM) along the evolutionary pathway: (a) 1LBL; (b) RA95.0; (c) RA95.5; (d) RA95.5-5; (e) RA95.5-8. The size of the sphere is indicative of the importance of the position, and black edges represent the communication path: i.e., how the different residues are connected. Those points mutated via DE are marked in purple (if they are included in the SPM), in orange if they are located in adjacent positions of the SPM (in parentheses is shown how far in the sequence from the closest residue included in SPM), and in green if the mutation is located at more than five positions away in sequence from the SPM. In 1LBL (a), the positions have been colored according to their evolutionary conservation using Evolutionary Trace Server (most conserved in red; less conserved in gray).46 (f) Analysis of the H-bond network in RA95.5-8. Those hydrogen bonds that have been maintained at least half of the simulation time are represented by sticks: in blue those hydrogen bonds that occur between backbone atoms, in pink those contacts between backbone and side-chain positions, and finally in yellow hydrogen bonds between side chains. The weight of the hydrogen bond (HB) stick indicates how frequently the HB is observed.

