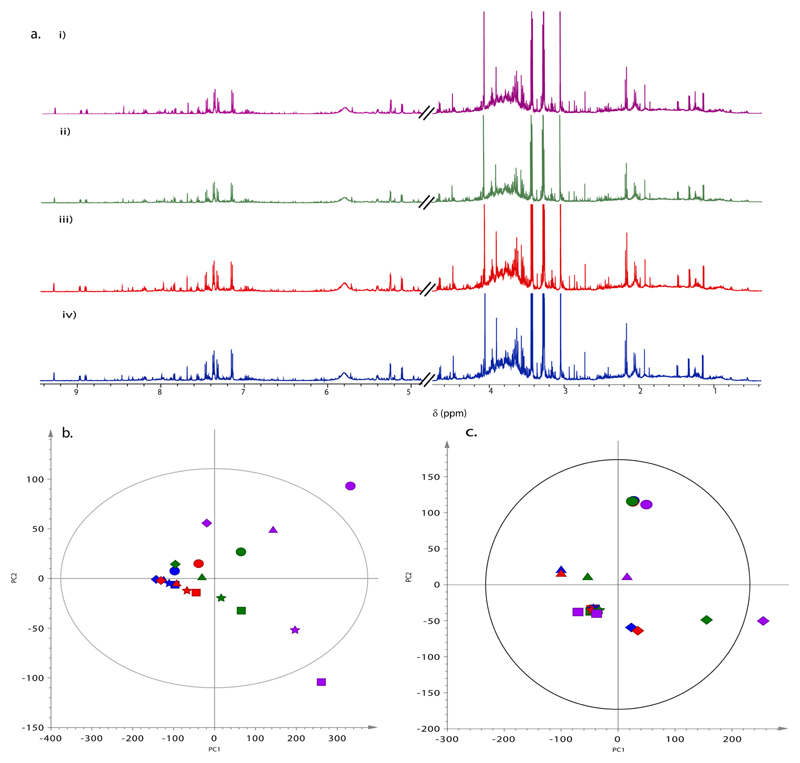
Figure 3.
(a) 1D 1H NMR spectra from one infant with a dilution series in effect with volumes of (i) 540, (ii) 270, (iii) 135, and (iv) 68 μL. (b) PCA of dilution series: R2(X) = 0.985 (first component accounts for 84% of the total variance); Q2 (cum.) = 0.941. (c) PCA of normalized diluted infant samples: R2(X) = 0.5 (first component accounts for 32% of the total variance); Q2 (cum.) = 0.29. Colors represent dilution series of (blue) 540, (red) 270, (green) 135, and (purple) 68 μL. Different shapes represent individual infants.

