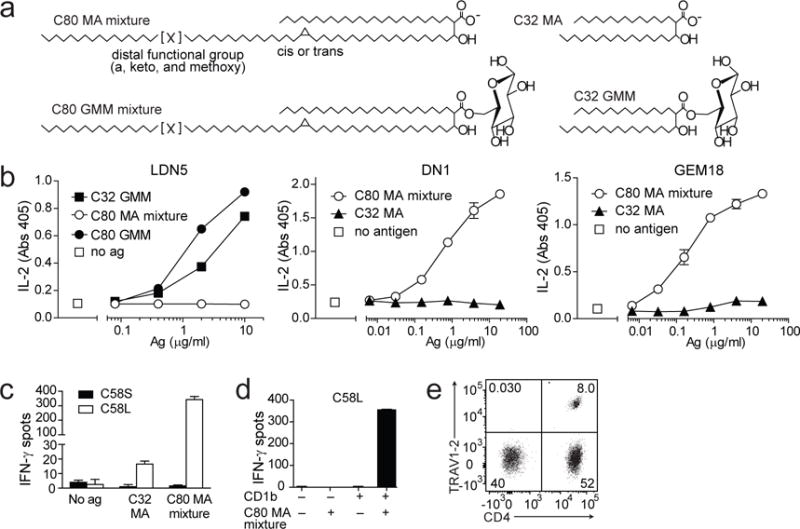
Fig. 1. M. tuberculosis MA and R. equi MA have different capacity to stimulate human T cells.

a Simplified chemical structure of C80 MA mixture, the naturally occurring mixture of MA that is synthesized by M. tuberculosis, C80 GMM, C32 MA, which is synthesized by R. equi and C32 GMM [24, 34]. C80 is the average tail length of a reported naturally occurring range of 72-86 carbon atoms, and C32 is the average length of a reported range of 30–36 carbon atoms [24, 34]. b LDN5, DN1, or GEM18 T cells (5×10⁴) were stimulated with monocyte-derived dendritic cells (5×10⁴) and the indicated antigens in duplicate wells. After 20 hours the supernatants were tested for IL-2 content. Cytokine standard curves are shown in Supplemental Fig. 5. Error bars indicate SEM. c The T cell line C58S was generated by polyclonal stimulation of T cells that were isolated based on IFN-γ release after stimulation with C32 MA. The T cell line C58L was obtained after stimulation with C80 MA mixture. Both T cell lines were tested for recognition of C32 MA and C80 MA mixture in an IFN-γ ELISPOT assay with duplicate wells using K562 cells transfected with CD1b as APC. d To determine dependence on CD1b for its activation, C58L was tested in an IFN-γ ELISPOT assay using mock transfected or CD1b-transfected K562 cells as APC. e Flow cytometric analysis of C58L stained with antibodies against CD4+ and TRAV1-2+. In b, one out of three independent experiments using GEM18 or LDN5 is shown. The experiment using DN1 confirming previously published data, was performed once. Experiments shown in c-e were performed two or more times.
