
Figure 4.
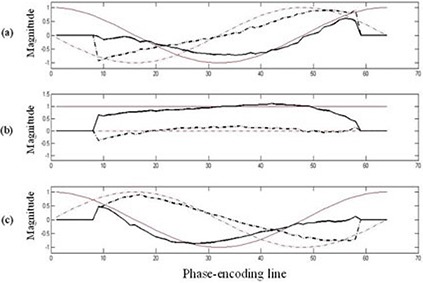
Comparison of spatial harmonic profiles obtained from coil sensitivities (black) vs. ideal target harmonic profiles (red). The harmonics used were negative first (a), zero (b), and positive first (c). The real part (solid line) and imaginary part (dashed line) of the complex harmonic profiles are shown.