
Figure 5.
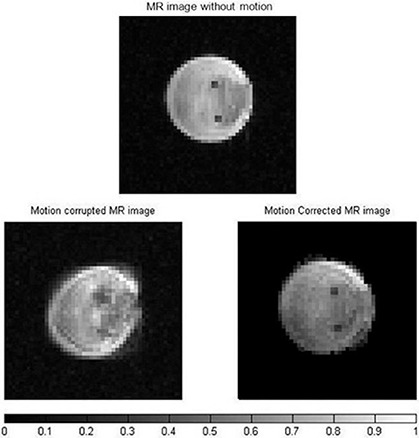
MR magnitude images of the phantom without motion (top), motion corrupted (left) and corrected (right). The imparted motion mimics that of liver during breathing. The color bar shows normalized signal intensity. There is a drop in signal after motion correction.