
Figure 7.
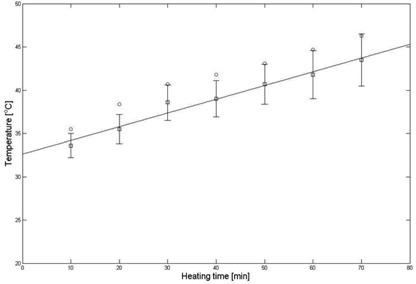
Comparison of temperatures (Fig. 6) obtained from a static phantom (black squares) by thermal imaging vs. those (red circles) measured via a thermocouple. The thermal imaging temperature is the average over 9 pixels around the location and the error bars on the thermal imaging are the standard deviation of the 9 pixels.