
Figure 5.
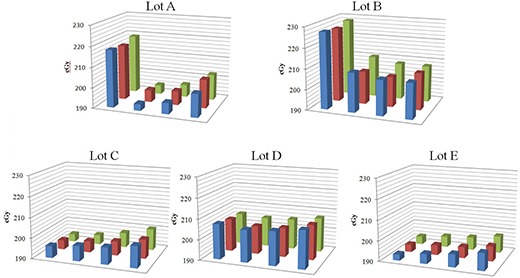
Dose distribution of lots A, B, C, D and E at 2 Gy. NetOD values of film pieces irradiated at 2 Gy were translated into dose values using the dose response curve. Film sheet position is displayed as in the schema in Fig. 1.
Official websites use .gov
A
.gov website belongs to an official
government organization in the United States.
Secure .gov websites use HTTPS
A lock (
) or https:// means you've safely
connected to the .gov website. Share sensitive
information only on official, secure websites.
Dose distribution of lots A, B, C, D and E at 2 Gy. NetOD values of film pieces irradiated at 2 Gy were translated into dose values using the dose response curve. Film sheet position is displayed as in the schema in Fig. 1.