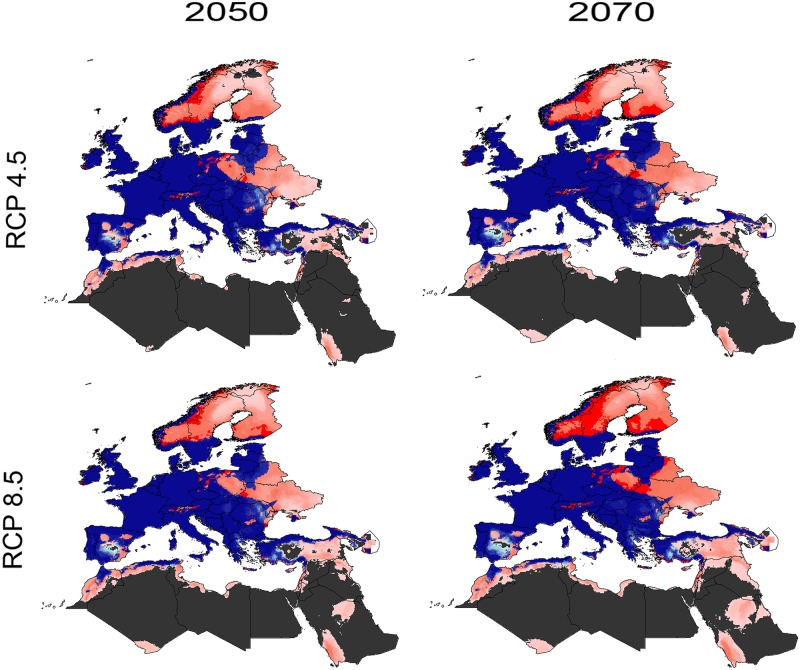
Fig 3. Summary of the binary modeled potential distributions of Ixodes ricinus under future conditions to show suitable areas and to illustrate differences between representative concentration pathways (RCPs) and time periods.
Blue color indicates model suitability under both present and future suitability (light blue denotes low confidence and dark blue denotes high confidence), red color represents predicted expansion areas in the future suitability (light red = low confidence, dark red = high confidence); dark gray areas are not suitable.

