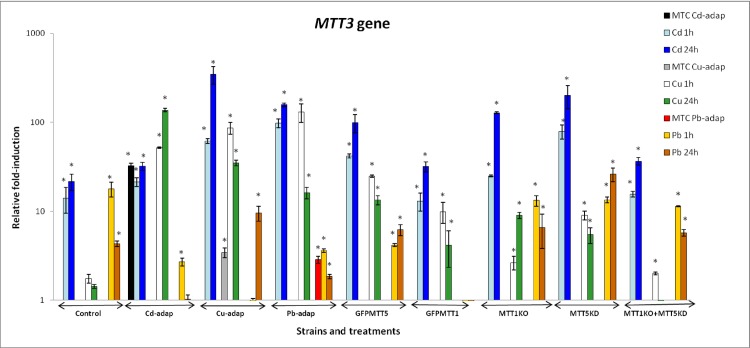
Fig 3. Comparison of relative fold-induction of MTT3 in different T. thermophila strains.
MTC: maximum tolerated concentration (115 μM Cd2+, 4 mM Cu2+ or 5.5 mM Pb2+). β-actin was used as the normalizer gene. Each histogram bar represents an average value ± standard deviation (see S3 Table) from two or three independent experiments. Relative induction values are represented in a logarithmic scale. Asterisks indicate significant differences from the control with p ≤ 0.05.

