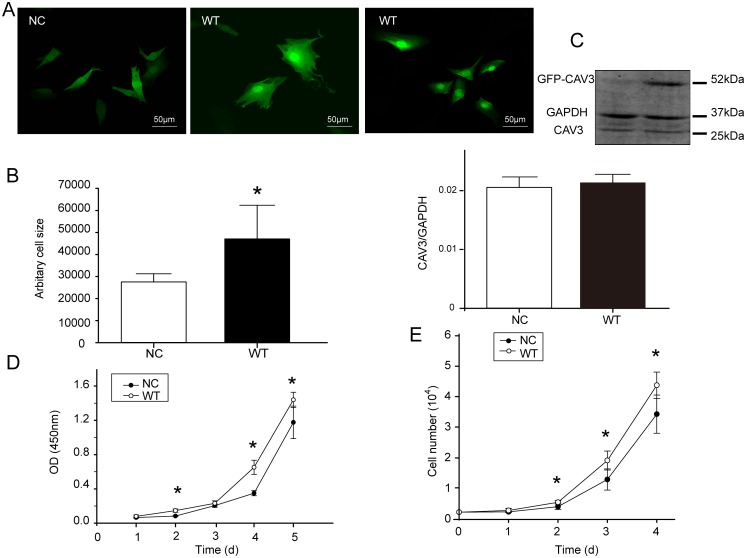
Fig 1. Effects of CAV3 transfection on cell surface area and cell numbers.
(A) Two groups of transfected cells viewed using confocal microscopy; scale bar, 20 μm. (B) The cell surface areas were analyzed using Image-Pro Plus, and the relative cell sizes are expressed as the mean ± SD (magnification: 40×). Data are from three fields per group and from three separate experiments, *p<0.05 compared with the NC group. (C) CAV3 endogenous expression: C2C12 cells normally contains a certain amount of CAV3. Endogenous CAV3 protein is approximately 25 kDa, whereas GFP-CAV3 recombinant protein is approximately 52 kDa. Therefore, a band at 25 kDa was detected in both the NC and WT groups, as expected, showed the endogenous CAV3 protein. In contrast, only the WT group showed the recombinant protein. The bar chart depicts expression of the endogenous protein. Data are presented as the mean ± SD. n = 5, *p< 0.05. (D) The cell growth curves determined using CCK-8 kit for 5 days. (E) Cell growth curves over 4 days. The growth curves of cells were determined by counting cells in a 24-well plate with standard medium and conditioned medium (n = 5).

