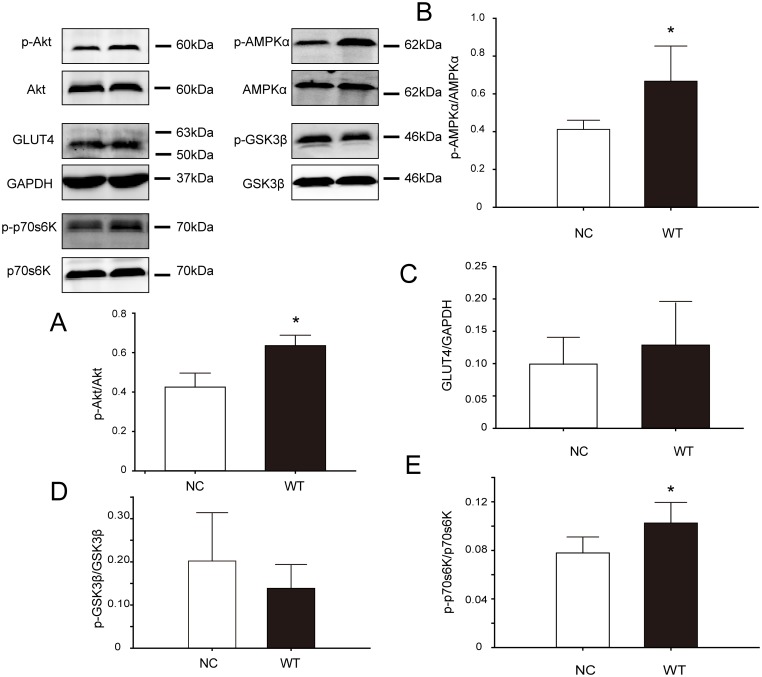
Fig 4. Changes in the expression of key signaling proteins in C2C12 cells after CAV3 transfection.
Total proteins from NC and WT cells were separated by SDS-PAGE and measured via western blot analysis. Representative immunoblots for the indicated proteins, with GAPDH as a loading control, are shown. The bar plots show semi-quantitative densitometry analysis for the normalized expression of the indicated protein. The p-Akt/Akt, p-AMPK/AMPK and p-p70s6K/p70s6K ratios were significantly increased in the WT group. Data are presented as the mean ± SD, n = 5, * p<0.05.

