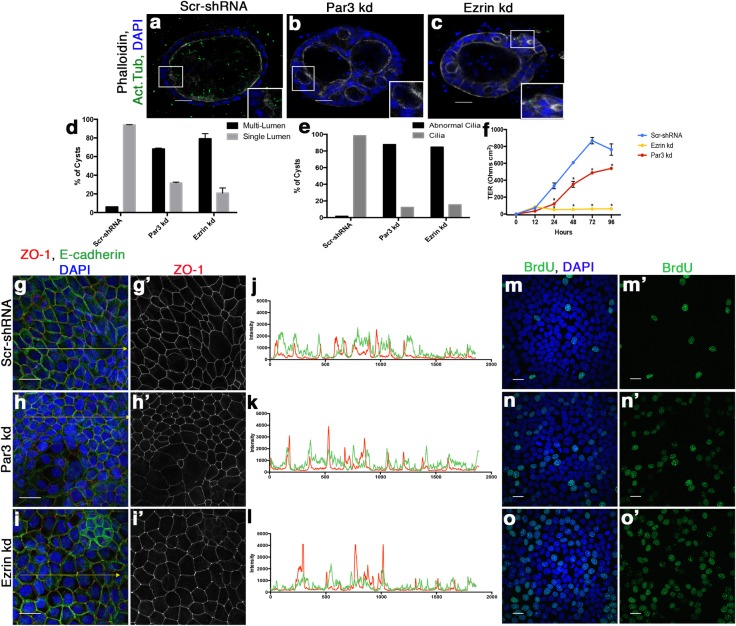
Fig 3. Depletion of apical polarity proteins cause a decrease in differentiation markers in epithelial 3D cell culture.
(a-c) Immunofluorescence staining on (a) Scramble-shRNA (Scr-shRNA), (b) Par3-shRNA (Par3-kd), and (c) Ezrin-shRNA (Ezrin-kd) 3D cysts for primary cilia by acetylated tubulin (ac. tub) and actin by Phalloidin. Scale bar, 20 μm (d, e) Quantification of the (d) number of lumens (n = 2) and (e) cilia (n = 1) present within all 3D cysts compared to scramble control cells. Par3-kd, Ezrin-kd, and Scr-shRNA had at least 49 cysts, 13 cysts, or 70 cysts examined per independent experiment. Abnormal cilia include cysts without cilia present or cilia that appears abnormal. Error bars represent SEM. (f) Transepithelial resistance demonstrates loss of functional TJ in Par3-kd and Ezrin-kd cells compared to Scr-shRNA cells calculated by Ohms per cm2. (g-i) Immunofluorescence staining for ZO-1 shows altered TJ protein localization in Par3-kd and Ezrin-kd cells indicative of decrease in differentiation by loss of epithelial cell junctions. E-cadherin is also stained to label junctional complexes. Scale bar, 20 μm (g’-i’) ZO-1 only staining to show the aggregation of ZO-1 at tricellular junctions in white. (j-l) Line plots of (g-i) showing intensity of E-cadherin (green line) and ZO-1 (red line) on the yellow line in the respective image, Scr-shRNA (j), Par3-kd (k), and Ezrin-kd (l). Note the overlap in E-cadherin and ZO-1 intensities in Scr-shRNA compared to distinct peaks of ZO-1 intensity in Par3-kd and Ezrin-kd indicative of mislocalized ZO-1. (m-o) Increased BrdU incorporation observed in Par3-kd and Ezrin-kd cell lines compared to the Scr-shRNA cells. (m’-o’) BrdU only staining of (m-o). Scale bar, 20 μm.

