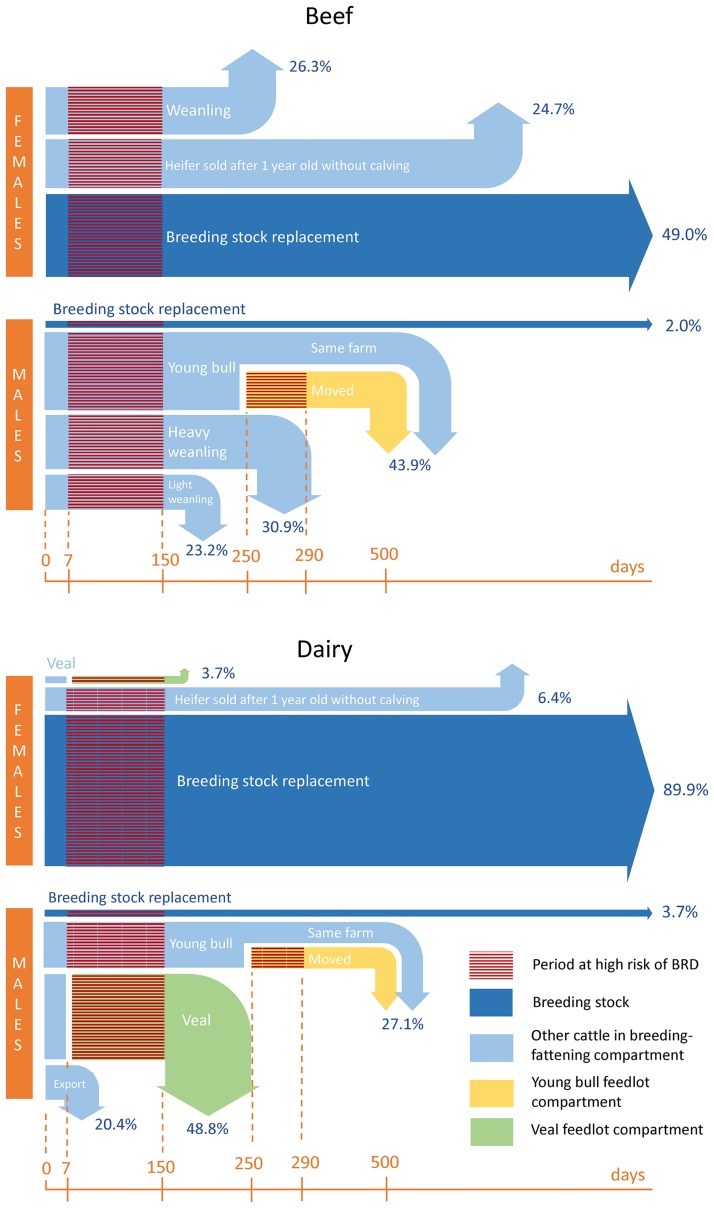
Fig 2. Representation of the French cattle value chain used in the study.
Arrow sizes and percentages indicate the assumed proportion of calves used for the different types of purposes in the beef and the dairy sector and periods at risk of BRD. Arrow ends correspond to the approximate time of departure from the livestock system (slaughter or export). Corresponding ages are indicated on the bottom orange timeline. Source: Groupe Economie du Bétail Institut de l’Elevage. La production de viande bovine en France: qui produit quoi, comment et où? Paris: Institut de l’Elevage. 2011.

