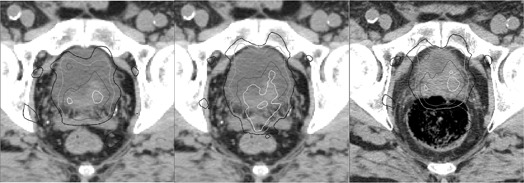
Figure 1.

An example of dose deformation for a fraction with a large organ deformation, showing the planned (left) and deformed (middle) doses overlaid on the plan CT and the reconstructed dose (right) overlaid on the daily CT. Isodose lines are 105% (white), 100% (dark gray), 90% (light gray), and 80% (black) of the prescription dose.
