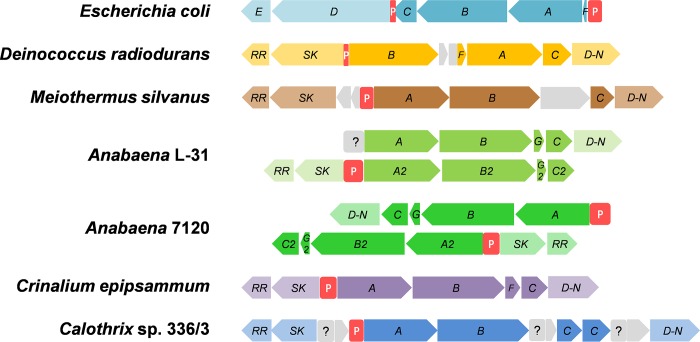
Fig 1. Comparison of organization of kdp operon in bacteria.
Organization of kdp operon in E. coli (model organism), representative examples from Deinococcus-Thermus group and cyanobacteria (as depicted in KEGG database [29]). The promoter regions are shown with red boxes denoted by the letter ‘P’. Undefined promoter region is shown with a gray box and question mark. A, B, C, D, E and F denote kdpA, kdpB, kdpC, kdpD, kdpE and kdpF genes, respectively. RR, SK and D-N denote response regulator, sensor kinase and N-terminal half of kdpD gene, respectively.

