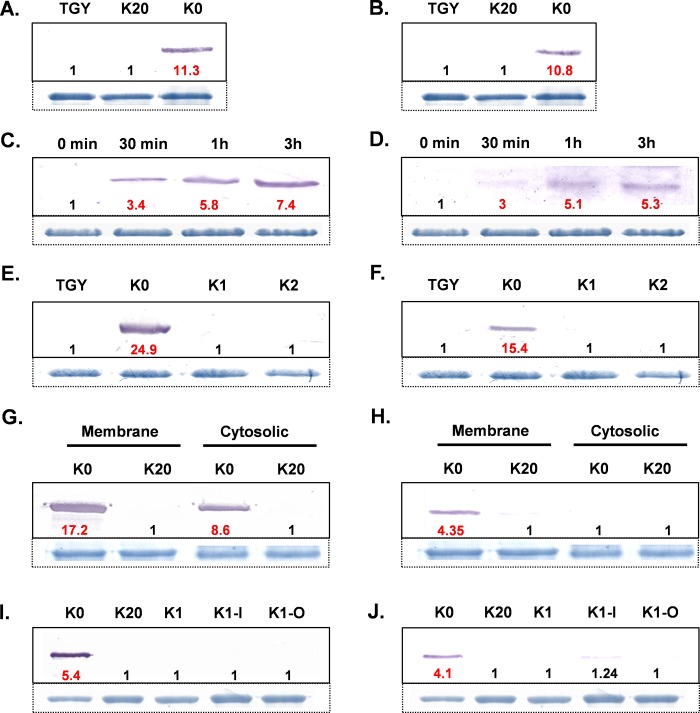
Fig 2. KdpB and RR expression under different growth conditions.
Expression of KdpB (A) or RR (B) proteins in D. radiodurans cells incubated in TGY, K20 or K0 media. Time course of induction of KdpB (C) or RR (D) proteins in D. radiodurans cells following shift from TGY to K0 medium. Expression of KdpB (E) or RR (F) proteins in D. radiodurans cells incubated in TGY, K0, K1 or K2 media. Localization of KdpB (G) or RR (H) proteins in D. radiodurans cells incubated in K20 or K0 media. Expression of KdpB (I) or RR (J) proteins in D. radiodurans cells grown either in K20 or K0 media, or exposed to ionic (-I, 0.1M NaCl) or osmotic (-O, 0.2M sucrose) stresses in K1 medium. The cellular proteins (100 μg) were resolved by 12% SDS-PAGE, electroblotted onto nitrocellulose membrane and immuno-stained using anti-KdpB or anti-RR antibodies as detailed in materials and methods. The top most protein band (~ 125 kDa) in the corresponding Coomassie stained gel is shown below Fig 2A, 2B, 2C, 2D, 2E, 2F, 2I and 2J, as loading control. For membrane or cytosolic protein extracts, 63 kDa protein band or 44 kDa protein band, respectively, are shown as loading controls (See S2 Fig for details on loading controls). Red bold numbers below the KdpB or RR immuno-stained bands indicate fold increase in their levels over the lanes in which these bands were not observed (denoted by 1).

