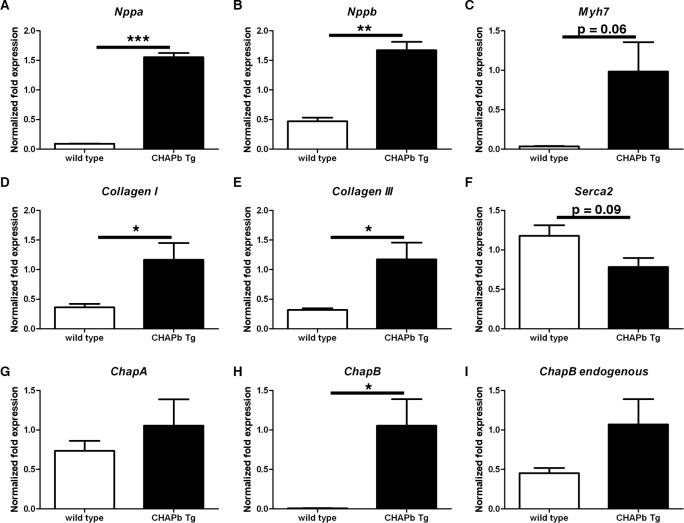
Fig 3. Expression of hypertrophy markers and collagens in left ventricle.
qPCR analysis showing mRNA expression of Nppa (A), Nppb (B), Myh7 (C), CollagenI (D) CollagenIII (E), Serca2 (F), ChapA (G), ChapB (H) and endogenous ChapB (I) in the left ventricle of wt (white bars) and CHAPb Tg (black bars) mice. Gapdh, Pgk and H2a were used as internal controls. (wt n = 3, Tg n = 3, T-test: *, p<0.05; **,p<0.01;***, p<0.001).

