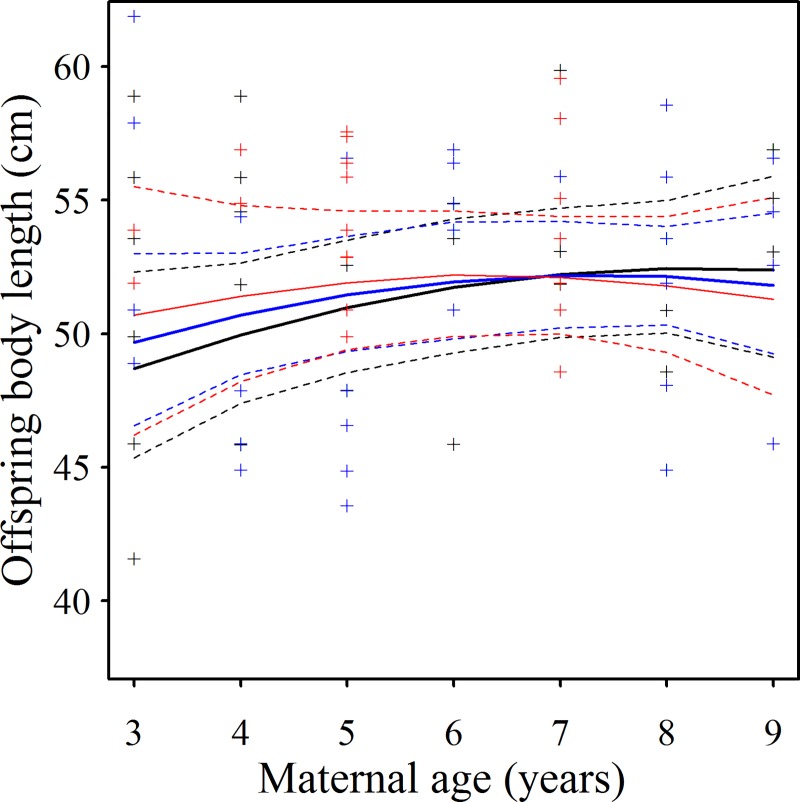
Fig 4. Offspring size was comparable for all litter sizes irrespective of mother age.
The relationship between maternal age 3–8 and ≥9) and offspring body length (BL, cm) at different litter sizes (LS) where black indicates LS = 1; blue LS = 2 and red LS ≥ 3. Solid lines indicate predictions and dashed lines indicate 95% prediction intervals. Predictions are from model averaged estimates of the most supported (ΔAICc < 4) models. The large overlap in prediction intervals suggests that the effects of LS and maternal age are marginal.

