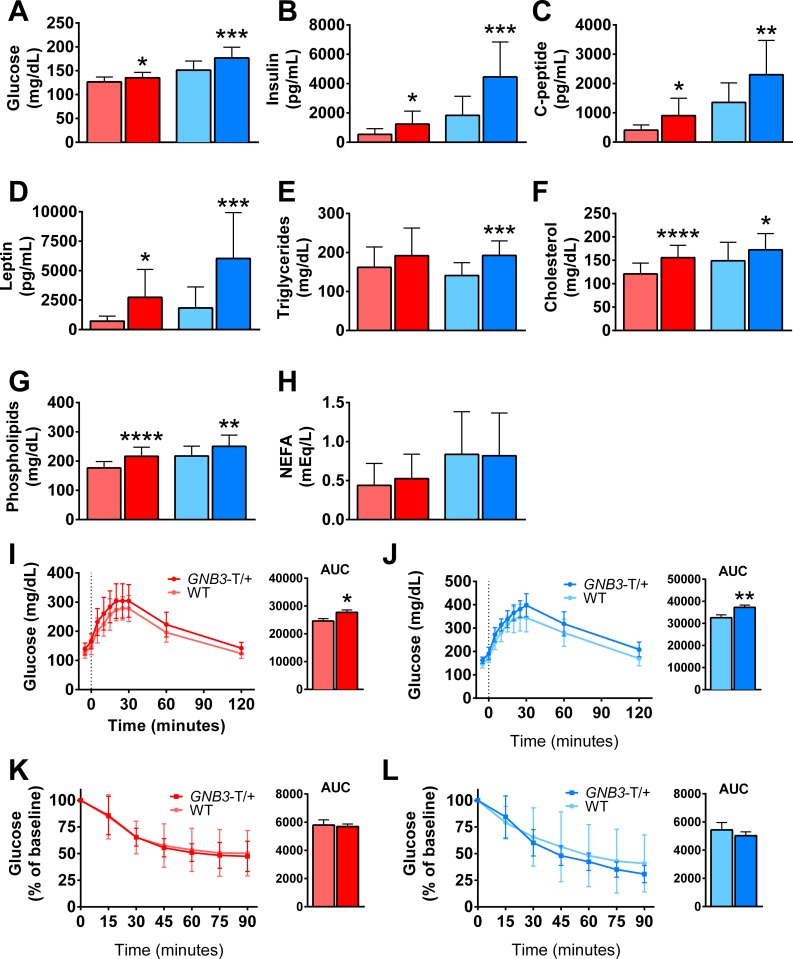
Fig 3. GNB3-T/+ mice have metabolic syndrome.
A. Fasting blood glucose, B. fasting plasma insulin, C. C-peptide, D. leptin, E. triglycerides, F. cholesterol, G. phospholipids and H. non-esterified fatty acids of mice. I. GTT and areas under the curve (AUC) of female and J. male mice. K. ITT and AUC of female and L. male mice. All mice are 20 weeks old. n = 15–23 mice per group in A, n = 11–20 mice per group in B-D, n = 16–25 mice per group in E-H, n = 18–22 mice per group in I, n = 17–18 mice per group in J, n = 14–16 mice per group in K, n = 10–17 mice per group in L. Data are mean ± SD. *P < 0.05, **P < 0.01, ***P < 0.001, ****P < 0.0001 vs. WT of same sex by unpaired Student’s t-test. Colors are the same as in Fig 2.

