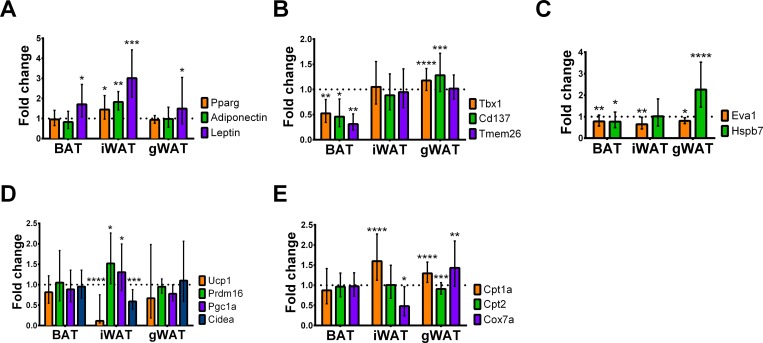
Fig 6. GNB3-T/+ mice have lower gene expression of Ucp1 in BAT, iWAT and gWAT, and lower gene expression of beige and brown adipocyte markers in BAT.
A. Gene expression profiles of adipogenic, B. beige adipocyte, C. brown adipocyte, D. oxidative phosphorylation, and E. mitochondria markers in BAT, iWAT and gWAT measured by quantitative RT-PCR. Fold change is GNB3-T/+ versus WT, mean ± SD. All mice are 20 weeks old. n = 3 mice per group and experiment was repeated 3 times. *P < 0.05, **P < 0.01, ***P < 0.001, ****P < 0.0001 vs. WT of same sex by unpaired Student’s t-test.

