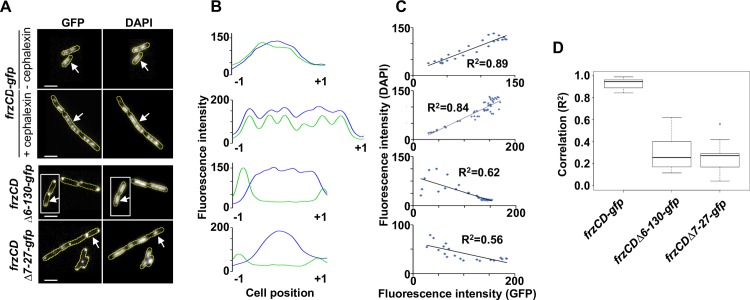
Fig 2. FrzCD-GFP colocalizes with the nucleoid in E. coli.
(A) Micrographs of E.coli cells carrying a GFP fusion on a plasmid and stained with the DNA DAPI stain. The genetic fusions are indicated on the left. Cells carrying frzCD-gfp were also treated with 10μg/ml cephalexin to visualize FrzCD-GFP colocalization with the multiple nucleoids of undivided cells. The white arrows indicate the cells whose fluorescence profiles are shown in (B). Cells surrounded by white boxes are taken from separate original micrographs. Scale bars correspond to 1μm. (B) GFP (green) and DAPI fluorescence (blue) profiles with the fluorescence intensity (arbitrary units) represented on the y axis and the cell length positions with -1 and +1 indicating the poles, on the x axis. (C) Correlation coefficients between the DAPI and GFP localization. R2 values > 0,5 indicate significant correlations. (D) Box plots indicate the medians of the correlation coefficients (R2) from 10 cells (from one biological replicate) of each of the indicated strains.

