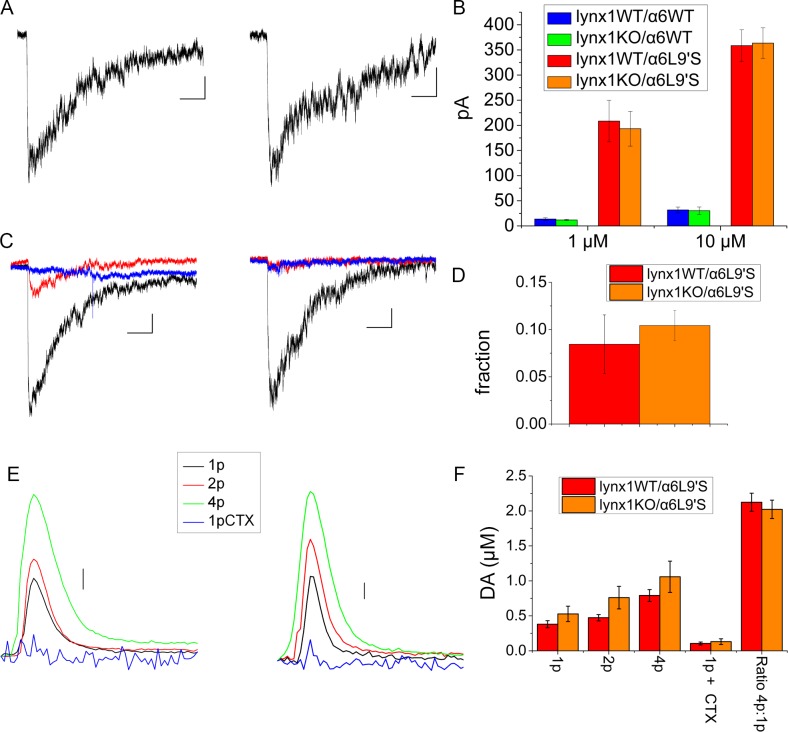
Fig 5.
A) Representative whole-cell nicotine-induced currents from SNc of lynx1WT/α6L9′S and lynx1KO/α6L9′S mouse brain slices (puffs of 10 μM nicotine). Left is lynx1WT/α6L9′S; right is lynx1KO/α6L9′S. The scale is 2 s and 50 pA. B) Average peak currents induced by 1 and 10 μM nicotine, including lynx1WT/α6WT, lynx1KO/α6WT, lynx1WT/α6L9′S, and lynx1KO/α6L9′S mice. Values for 1 μM nicotine: lynx1WT/α6WT 13.6 ± 2.7 pA (7 cells), lynx1KO/α6WT 11.8 ± 1.4 pA (5 cells), lynx1WT/α6L9′S 208.5 ± 41.3 pA (11 cells), lynx1KO/α6L9′S 193.2 ± 34.4 pA (15 cells). Values for 10 μM nicotine: lynx1WT/α6WT 31.7 ± 5.9 pA (7 cells), lynx1KO/α6WT 30.2 ± 7.5 pA (5 cells), lynx1WT/α6L9′S 358.5 ± 31.6 pA (12 cells), lynx1KO/α6L9′S 363.5 ± 30.4 (17 cells). No significant differences were found between lynx1WT/α6WT and lynx1KO/α6WT or between lynx1WT/α6L9′S and lynx1KO/α6L9′S. C) Currents induced by 1 μM nicotine puffs before and after application of α-CtxMII. Response to 1 μM nicotine is black trace; red trace is 5 minutes after starting the flow of 100 μM α-CtxMII; blue trace is after 10 minutes of α-CtxMII. The left panel is lynx1WT/α6L9′S; the right panel is lynx1KO/α6L9′S. The scale is 2 s and 50 pA. D) Average fraction of signal remaining after application of 100 μM α-CtxMII. For lynx1WT/α6L9′S the percent remaining is 0.08 ± 0.03% (2 cells). For lynx1KO/α6L9′S the percent remaining is 0.10 ± 0.02% (3 cells). There is no significant difference between the two genotypes. E) Average DA release in response to various stimulations, as measured with FSCV. The left panel is lynx1WT/α6L9′S; the right panel is lynx1KO/α6L9′S. The scale is 0.1 μM DA. F) Average peak DA response. The values for lynx1WT/α6L9′S in μM DA are for 1p 0.38 ± 0.05, for 2p 0.47 ± 0.04, for 4p 0.79 ± 0.08, and for 1p + α-CtxMII 0.10 ± 0.02. The values for lynx1KO/α6L9′S in μM DA are for 1p 0.53 ± 0.11, for 2p 0.76 ± 0.16, for 4p 1.05 ± 0.22, and for 1p + α-CtxMII 0.13 ± 0.04. For the lynx1WT/α6L9′S the ratio of 4p:1p was 2.12 ± 0.13 and for the lynx1KO/α6L9′S the ratio of 4p:1p was 2.02 ± 0.13. For lynx1WT/α6L9′S there were 4 animals, 6 recording sites, except for the α-CtxMII studies that used 2 sites in 2 different animals. For lynx1KOα6L9′S there were 5 animals, 9 recording sites, except for the α-CtxMII studies that used 4 sites in 4 different animals. There were no significant differences between the two genotypes.

