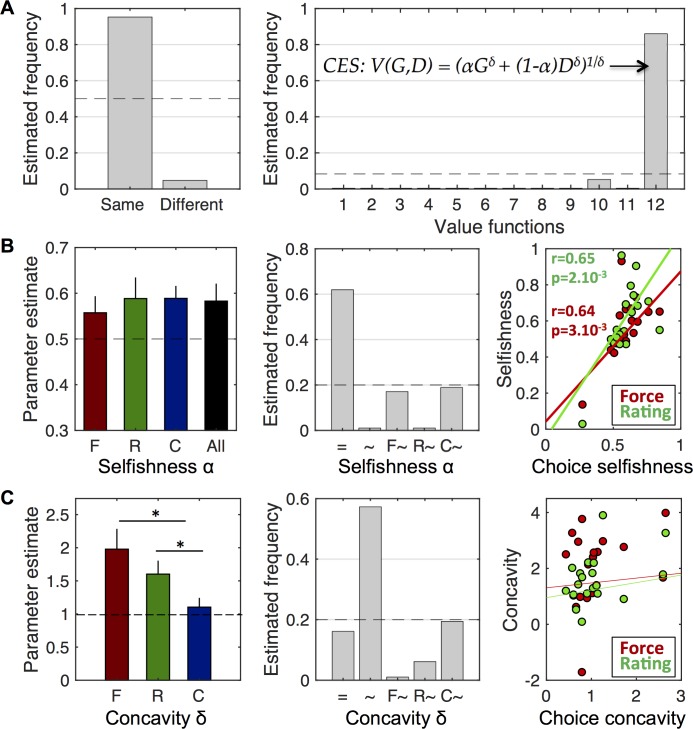
Fig 2. Comparison of value functions and their parameters.
A. Comparison of value functions underlying behavior in the three tasks. Left: Estimated frequency for the family of models in which the three tasks are explained by the same value function and the family of models using different value functions. Right: Estimated frequencies obtained for the twelve models (value functions) belonging to the ‘same’ family. The winner is CES function (model 12), see equation on the graph, with V(G,D) the value of gain G and donation D, α the selfishness parameter and δ the concavity parameter. Dashed lines indicate chance levels (one over the number of models) B. Comparison of selfishness parameter across tasks. Left: Mean parameter estimates in the three tasks (F, R and C) separately and in the three tasks together (All). The dashed line (α = 0.5) indicates no bias toward one or the other dimension (gain or donation). Error bars indicates S.E.M. Middle: Estimated frequencies of models including one single selfishness parameter for the three tasks (=), three different selfishness parameters (~), or only one different from the two other (F~, R~, C~, with ‘X~’ standing for ‘task with a different parameter’). Dashed line indicates chance level. Right: Correlation of selfishness parameters between choice and force tasks (red) and between choice and rating tasks (green) across subjects. C. Same analysis as in B but for the concavity parameter. The dashed line in the left graph (δ = 1) corresponds to the linear model. Stars indicate significant differences between tasks.

