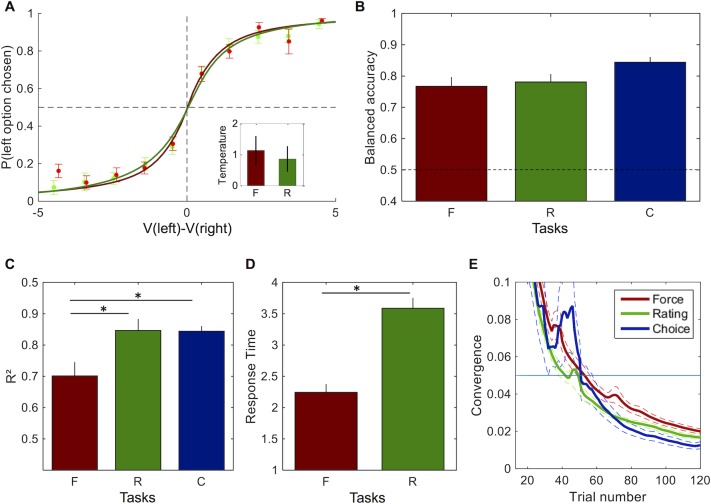
Fig 3. Comparison of estimation efficiency.
A. Proportion of choices according to the difference between option values computed with the CES value function inferred either from the force task (red) or the rating task (green). Observed choices (circles) were fitted using logistic regression (continuous lines). Inset represents temperature estimates from logistic fits. B. Balanced accuracy according to the CES value function inferred from the force (red) and rating (green) tasks. C. Coefficient of determination R2 for the fit of each task (Force, Rating and Choice). D. Response time in force and rating tasks. E. Convergence measure according to trial number (with optimized trial order) in the force (red), rating (green) and choice (blue) tasks. Error bars indicate S.E.M. Stars indicate significant differences between two tasks.

