
Figure 1. Overall structure of the Vps4 complex.
(A) Ribbon representation of the complex viewed from the ‘top’ N-terminal side of Vps4 and N-terminal end of the peptide. (B) Similar orientation as panel A showing a segmented map contoured around Vps4 and peptide. (C) Same as panel B viewed from the side with density for subunit F removed for clarity.

Figure 1—figure supplement 1. Cryo-EM of the Vps4 complex.

(A) Representative cryo-EM micrograph of Vps4101-437-Hcp1 particles. (BC) Representative 2D class averages, (B) before and (C) after Hcp1 signal subtraction. (D) Gold-standard FSC of the Hcp1-subtracted particle reconstructions on independent (odd:even particles) halves of the data (blue) and FSC between the refined model and the density map (orange). (E) Cross-validation of refined model (see Materials and methods). (F) Angular distribution plot based on orientation assignments in RELION and visualized in UCSF Chimera. Cylinders scaled (low to high) and colored (blue to red) proportional to number of particles in the assigned orientation. (G) Local resolution estimates determined by ResMap (Kucukelbir et al., 2014).
Figure 1—figure supplement 2. Classification and signal-subtraction scheme for the Vps4 complex.

140,958 particles were input for 3D classification. 109,241 particles were sorted into classes with good Vps4 features and used to generate a consensus reconstruction of the entire Vps4101-437-Hcp1 complex at 4.1 Å resolution. Signal subtraction of Hcp1 was performed using a previously described strategy (see Materials and methods). An additional round of 3D classification was performed using the Hcp1-subtracted particles. 82,225 particles were sorted into a single class with high-resolution Vps4 features and used to generate the final 3.2 Å Vps4 reconstruction.
Figure 1—figure supplement 3. Focused classification of Vps4 subunit F and Vta1.

(A) Representative masking scheme for subunit F. Custom masks were generated for structurally heterogeneous features and focused 3D classification was performed using the masks. Classes with good features were used to isolate particles for additional rounds of RELION auto-refinement. (B) Representative masking scheme for Vta1.
Figure 1—figure supplement 4. Surface Representation.
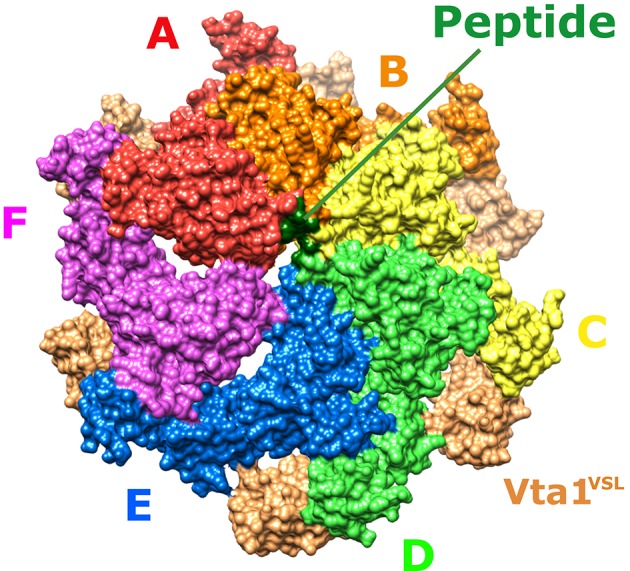
Similar orientation to Figure 1A. Shows the gaps between the subunit F large ATPase domain and its neighboring subunits, and the highly solvated channel between subunit F and the peptide.
Figure 1—video 1. Representative density.
Download video file (4.6MB, mp4)
DOI: 10.7554/eLife.31324.007
Charge density map shown over the β-sheet of the large domain of subunit B.