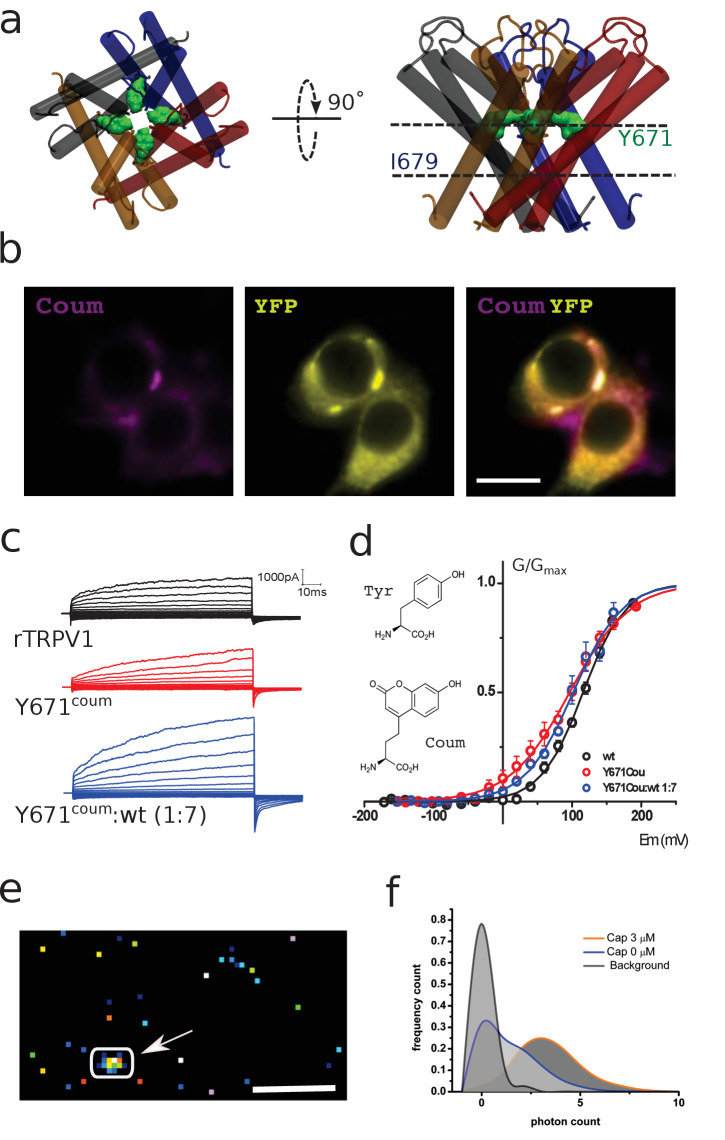
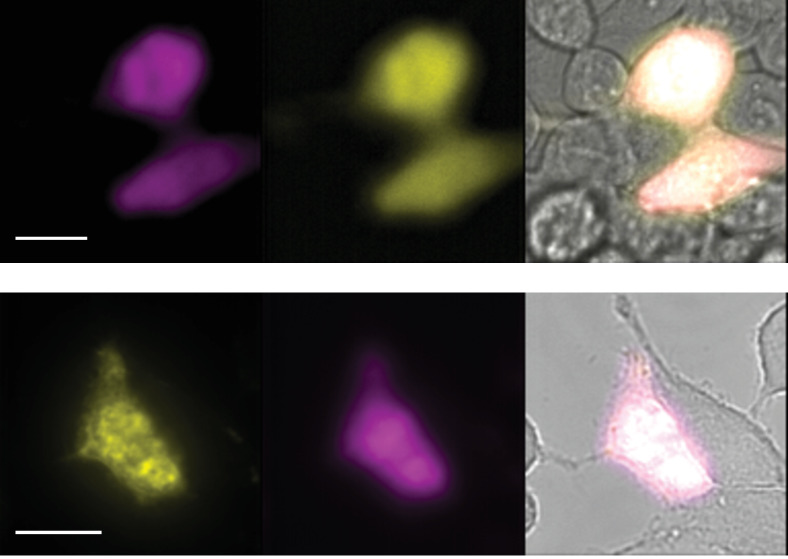
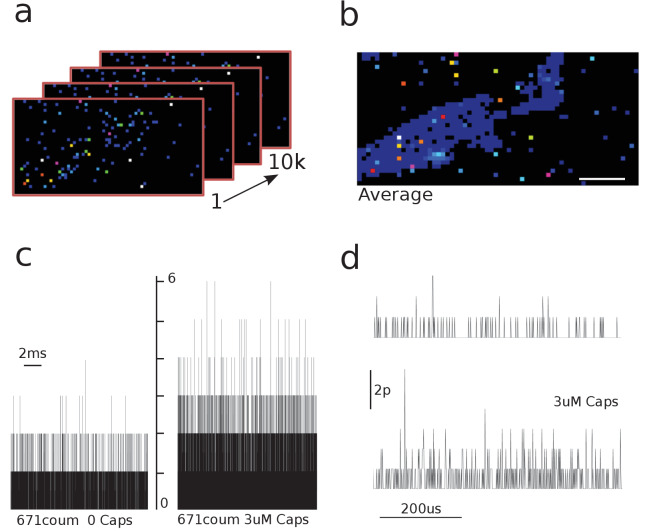
Figure 1. Functional expression of coumarin-containing TRPV1 channels at the membrane of HEK-293T cells.
(a) Top-down and lateral view of the pore region of rTRPV1 tetramers. Dashed lines denote the positions of putative gates, a canonical gate at I679 and a secondary constriction within the pore at Y671 (green shade). The different subunits are shown in different colors. (b) Epifluorescence images obtained from transiently transfected HEK-293T cells. Cells were co-transfected with wild-type rTRPV1-YPF and with rTRPV1-Y671coum. The scale bar corresponds to 10 µm. Images correspond to the average of 50 frames. (c) Representative traces obtained from transiently transfected HEK-293T cells subjected to voltage steps from −180 mV to +180 mV, in 20 mV increments, for the three different conditions indicated. No TRPV1 currents were seen from expressed Y671TAG channels co-expressed with the coumarin Rs and tRNA but lacking the supplemented amino acid in the culture media. (d) Conductance-voltage relation for the wild-type rTRPV1 (black) and the two different coumarin-containing channels (TRPV1-coumarin alone in red; 1xTRPV1coumarin +7xTRPV1wt in blue). Curves were fitted to a Boltzmann distribution of the form I = Imax/(1 + exp([zF(V-V0.5)/RT]), where z is the voltage dependency, V0.5 is the half-activation voltage, and Imax is the maximum current. Each curve represents the average of at least six different experiments performed at 20°C. Error bars correspond to standard errors of the mean (SEM). The structure of coumarin and tyrosine are depicted in wireframe. (e) Ten thousand frames were averaged and a threshold was set on the averaged image in order to define regions of interest (arrow indicates ROI). The scale bar corresponds to 5 µm. (f) The photon count was extracted from the original set of frames. Capsaicin incubation promotes a higher photon count distribution.


