Figure 3. Optical studies of ion channel gating.
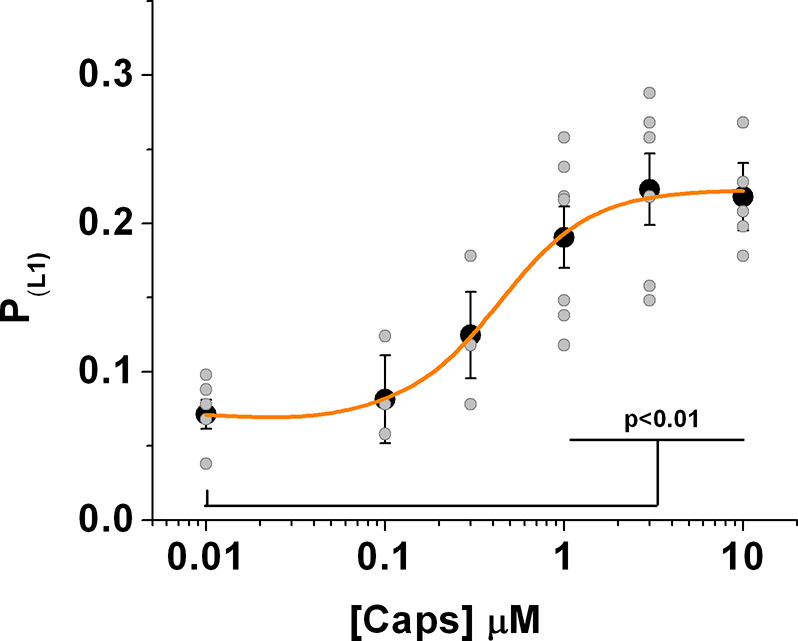
(a) Stationary noise of single spots, with each curve corresponding to the averaged fitted curves for the indicated conditions (n = 7, paired). The autocorrelation function was obtained for background (gray), capsaicin free (blue), and 3 μM capsaicin (orange). (b) Analysis of fluorescence fluctuations. Superimposed traces of capsaicin (blue) and background (red). The threshold for level one is highlighted (2.5 standard deviations [SD], dotted line). The gray box indicates the zoomed-in portion of the recording presented in the inset below, with the dotted lines indicating background average.. An idealization is shown in black. (c) Semi-log plot of the amplitude versus dwell-time shows a shortening of mean time L0. (d) Plot summarizing datasets of amplitude versus dwell time at 0 and 3 μM capsaicin (n = 5, paired). Error bars correspond to SEM. (e) Dose–response curve showing changes in the probability of level 1 (PL1), calculated from non-corrected fluorescence fluctuations, for the two positions tested for the indicated channel types expressing coumarin. (f) Normalized dose–response curves for background subtracted fluorescence fluctuations (orange) and whole-cell electrophysiological response (purple). The electrophysiological response was tested at −70 mV in the presence of the indicated concentrations of capsaicin. Error bars correspond to SEM.

Figure 3—figure supplement 1.

Figure 3—figure supplement 2. Distribution of the whole data set obtained from the fluctuation analysis of the fluorescence signal.