. 2017 Sep 21;6:e25012. doi: 10.7554/eLife.25012

Figure 2. Genetic complementation of brush.

(A) Genomic region surrounding BRUSH on L. japonicus chromosome 2 showing a cluster of five CNGC.IVA genes (red asterisk, brush causative mutation). CNGC.IVA2 contains a large transposon (Tn) insertion. CNGC.IVA2 contains a large transposon insertion (shown as a gap). (B) Complementation assay of brush roots by overexpression (ubiquitin promoter, UBQ) of the four expressed CNGC.IVA cluster members (bright field, top panel). The presence of red fluorescent nodules (arrow) colonized by Mesorhizobium loti expressing the red fluorescent protein DsRED (lower panel) indicates successful bacterial infection and thus complementation. (C) Number of nodules per transformed plant from (B) (n = 10 for all constructs). (D) Quantitative reverse-transcription PCR analysis of brush transcript levels after RNAi targeting either the 5'UTR or 3' UTR of brush. The normalized fold expression of brush is shown relative to empty vector control roots (n = 6 for all constructs). (E) Complementation analysis of brush expressing RNAi fragments targeting either the 5'UTR or 3'UTR of brush in the brush mutant. Panels are the same as (B). (F) Number of nodules per transformed plant (n = 10 for all constructs) from (E). Roots for both complementation experiments were observed 6 weeks after inoculation with rhizobia. Scale bars in (B) and (E) represent 1 mm. Letters in (C), (D), and (F) indicate different statistical groups (ANOVA followed by Tukey’s HSD test). F(4, 45)=10.86, p < 0.001 (C), F(2, 15)=20.82, p < 0.001 (D), F(2, 27)=22.72, p < 0.001 (F).

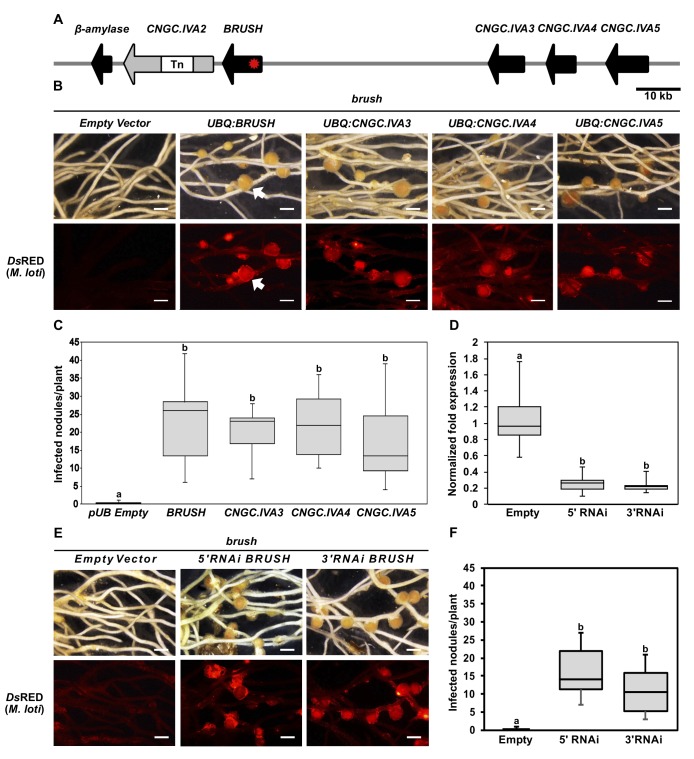
Figure 2—source data 1. Figure 2C source data.
DOI: 10.7554/eLife.25012.015
Figure 2—source data 2. Figure 2D source data.
DOI: 10.7554/eLife.25012.016
Figure 2—source data 3. Figure 2F source data.
DOI: 10.7554/eLife.25012.017
Figure 2—source data 4. Figure 2—figure supplement 1B source data.
DOI: 10.7554/eLife.25012.018
Figure 2—source data 5. Figure 2—figure supplement 3A,C source data.
DOI: 10.7554/eLife.25012.019
Figure 2—source data 6. Figure 2—figure supplement 4B source data.
DOI: 10.7554/eLife.25012.020
Figure 2—source data 7. Figure 2—figure supplement 5A source data.
DOI: 10.7554/eLife.25012.021

Figure 2.

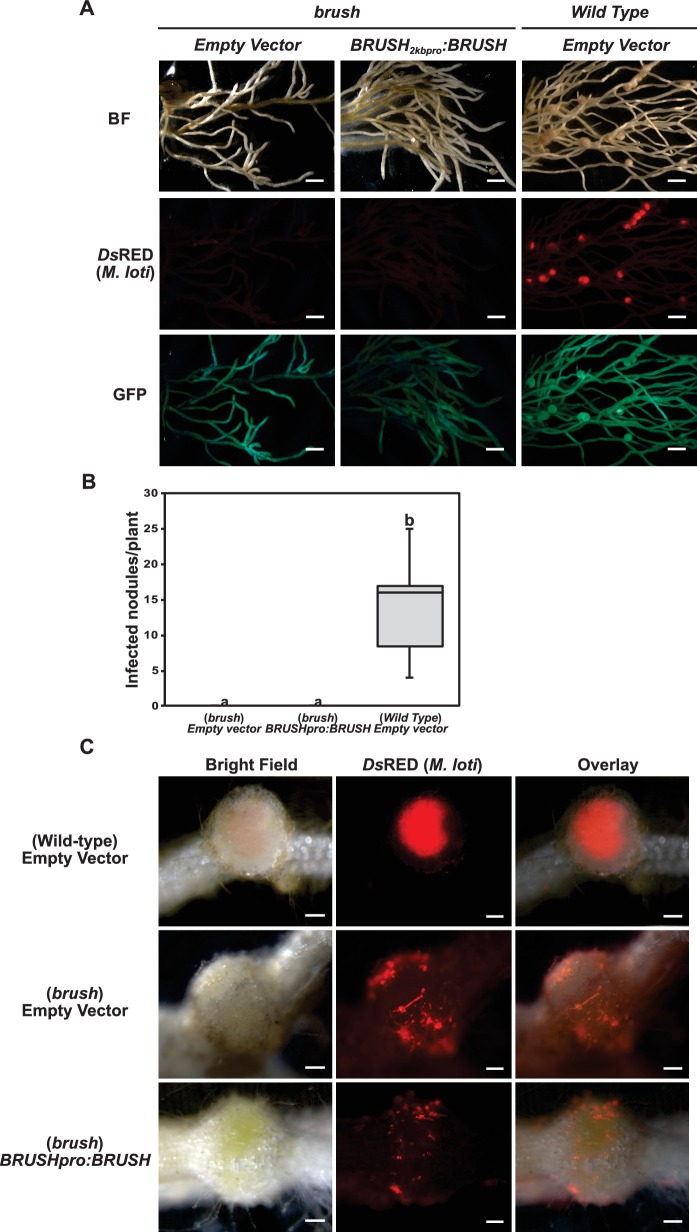
Figure 2—figure supplement 1. Expression of the BRUSH native genomic sequence in brush.

Figure 2—figure supplement 1.

(A) Complementation assay of brush roots by transformation of BRUSH2kbpro:BRUSHgenomic or empty vector relative to Gifu wild type. No infected nodules were observed in brush roots expressing the BRUSH genomic sequence. Shown are DsRED fluorescence of rhizobia (middle panel) and GFP fluorescence (lower panel) as transformation reporter. Composite plants were transfered into Weck jars, cultivated at 26°C, and inoculated with M. loti expressing DsRed. Roots were analyzed 4 weeks after inoculation. (B) Box plot showing the number of nodules per transformed plant (n = 8) from (A). (C) Close-up of transformed roots. Scale bars in (A) represent 2 mm, 0.2 mm in (C). Different letters in (B) indicate different statistical groups (ANOVA followed by Tukey’s HSD test, F(2, 21)=33.60, p < 0.001).

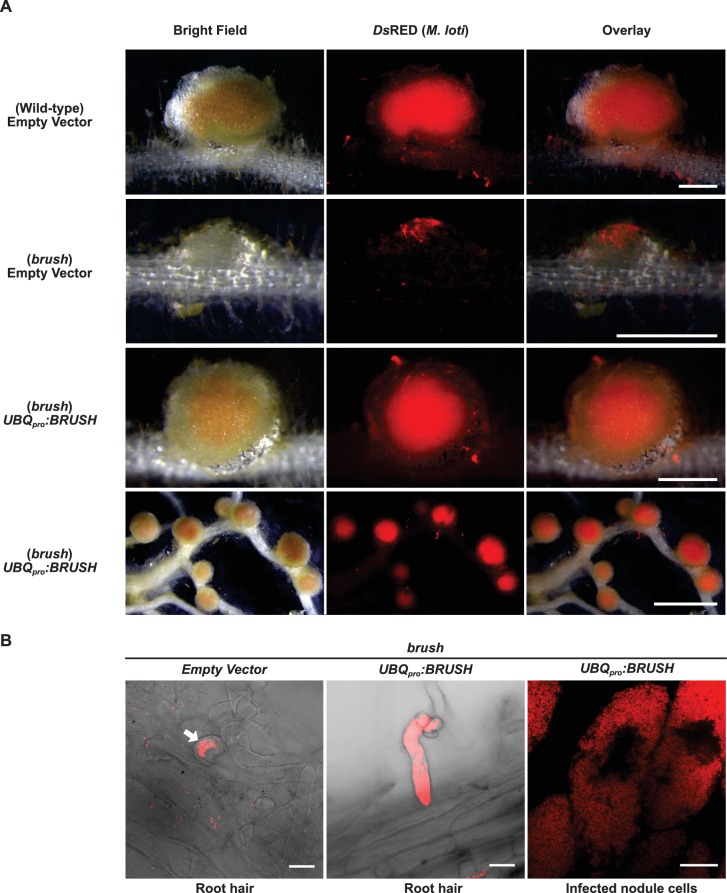
Figure 2—figure supplement 2. Complementation of brush by overexpression of BRUSH.

Figure 2—figure supplement 2.

(A) Nodulation and rhizobial infection assay upon hairy root transformation of the brush mutant with an empty vector control or an UBQpro:BRUSHgenomic construct compared to the wild-type (Gifu) hairy roots transformed with empty vector. Infected nodules were observed in brush roots constitutively expressing the BRUSH genomic sequence. Shown are bright-field images of roots and DsRED fluorescence of rhizobia. (B) Rhizobia remain entrapped in infection pockets in brush root hairs (left image, arrow). Overexpression of BRUSH restores infection of root hairs (middle) leading to infected nodule cells (right). The root hair images are composites of bright field and DsRED fluorescence. Plants with hairy roots were grown in Weck jars, cultivated at 26°C, and inoculated with M. loti expressing DsRed. Roots were analyzed 4 weeks after inoculation. Scale bars represent 0.5 mm in the top three panels of (A), lower panel 2 mm. Scale bars in (B) represent 15 µm.

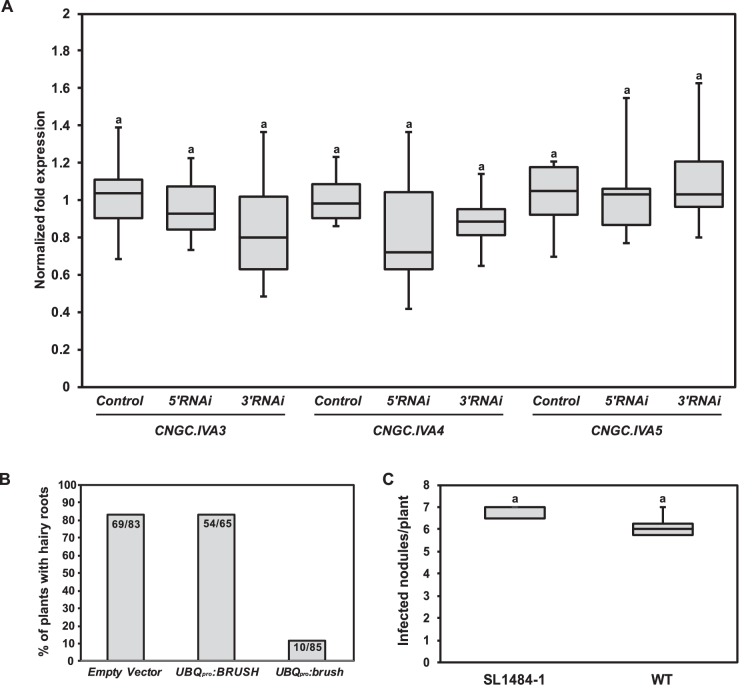
Figure 2—figure supplement 3. RNAi off-target controls and phenotypes associated with either overexpression of brush or a null BRUSH allele.

Figure 2—figure supplement 3.

(A) RT-qPCR of CNGC.IVA3, CNGC.IVA4, and CNGC.IVA5 in hairy roots transformed with an empty vector control (control) or an RNAi fragment targeting either the 5'UTR (5'RNAi) or 3'UTR (3'RNAi) of brush in the brush mutant. The normalized fold expression is shown relative to the average expression level in control roots transformed with the empty vector (n = 6 for all constructs). Transgenic root tissue was isolated 6 weeks after inoculation with rhizobia. (B) Hairy root formation efficiency of Gifu wild-type plants inoculated with A. tumefaciens carrying a T-DNA containing either UBQpro:BRUSHgenomic or UBQpro:brushgenomic or empty vector as a control. Numbers on the columns indicate the number of plants with GFP-positive hairy roots per total number of inoculated plants. (C) A BRUSH TILLING line (SL1484-1) with a G357A exchange leading to a stop codon (W119Stop) was isolated. Nodule formation in homozygous SL1484-1 plants (n = 3) was not impaired relative to wild-type (n = 8). Plants were cultivated at 26°C and inoculated with M. loti MAFF DsRed. Nodules were counted 2 weeks after inoculation. Letters in (A,C) indicate statistical groups. (A) ANOVA followed by Tukey’s HSD test; F(8, 45)=0.9405, p > 0.05, (C) t-test, p > 0.05.

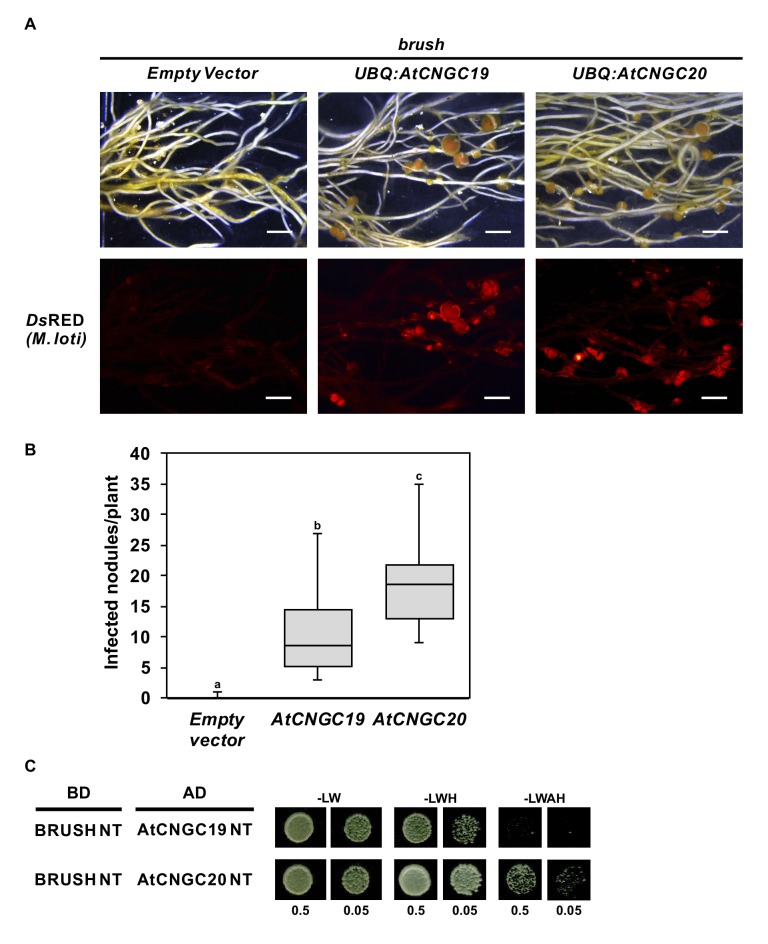
Figure 2—figure supplement 4. Complementation of brush by overexpressing AtCNGC19 or AtCNGC20.

Figure 2—figure supplement 4.

(A) Nodulation and rhizobial infection assay upon hairy root transformation of brush with T-DNA constructs leading to overexpression of AtCNGC19 and AtCNGC20 or with an empty vector as a control. (B) Box plot showing the number of DsRED-positive nodules per transformed plant (n = 10 for all constructs). (C) Yeast two-hybrid interaction assay with the BRUSH N-terminus (BRUSH NT) fused to the GAL4 binding domain (BD) and either AtCNGC19 NT or AtCNGC20 NT fused to the GAL4 activation domain (AD). Yeast cells were resuspended in water (OD600= 0.5 and 0.05) and spotted onto -LW (leucine, tryptophan), -LWH (leucine, tryptophan, histidine) and -LWAH (leucine, tryptophan, adenine, histidine) solid media. The lower panel in (A) contains images of the DsRED channel to visualize Mesorhizobium loti. Roots were observed 6 weeks after the addition of rhizobia. Scale bars in (A) represent 2 mm. Different letters in (B) indicate different statistical groups (ANOVA followed by Tukey’s HSD test, F(2, 27)=20.94, p < 0.001).

Figure 2—figure supplement 5. CNGC.IVA gene expression in Lotus japonicus roots after rhizobial inoculation.

Figure 2—figure supplement 5.

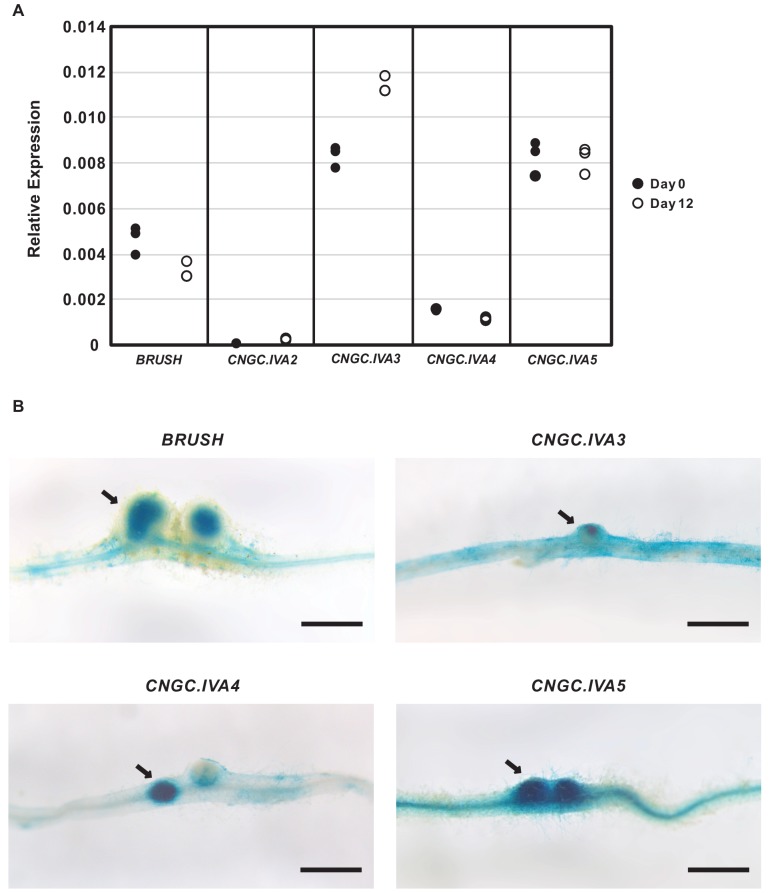
(A), Expression of CNGC.IVA cluster genes in roots as analyzed by RT-qPCR on Day 0 (●) and Day 12 (○) after inoculation with Mesorhizobium loti. Each point represents a biological replicate. Shown is the relative expression as calculated with the 2△△CT method using eEF-1Aα as a reference. (B) Promoter activity of CNGC.IVA genes three weeks after inoculation with Mesorhizobium loti. The 2 kb promoter sequence of each gene was fused to GUS and introduced into Gifu wild-type roots by hairy root transformation. Expression of GUS was detected in developing nodules (arrows) after overnight staining. Scale bars in (B) represent 1 mm.

Figure 2—figure supplement 6. BRUSH expression in roots during nodulation.

Figure 2—figure supplement 6.

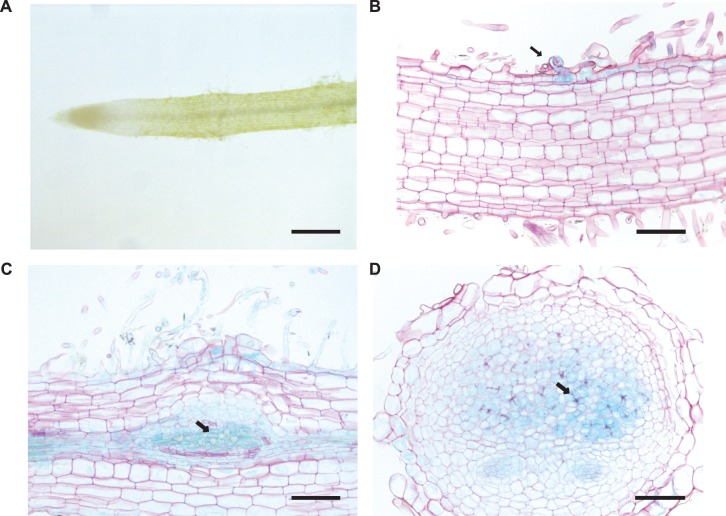
(A) BRUSH 2 kb promoter activity was not evident in the root susceptible zone prior to inoculation. After inoculation with Mesorhizobium loti, promoter activity was observed in infected root hairs (B, arrow), nodule primordia (C, arrow) and infected nodule cells (D, arrow). The promoter sequence was fused to GUS and introduced into Gifu wild-type plants by hairy root transformation. Roots were harvested 3 weeks after inoculation with rhizobia, stained for GUS activity overnight, and counterstained with ruthenium red after sectioning (B,C,D). Scale bars represent 0.6 mm (A), and 0.2 mm (B,C,D).