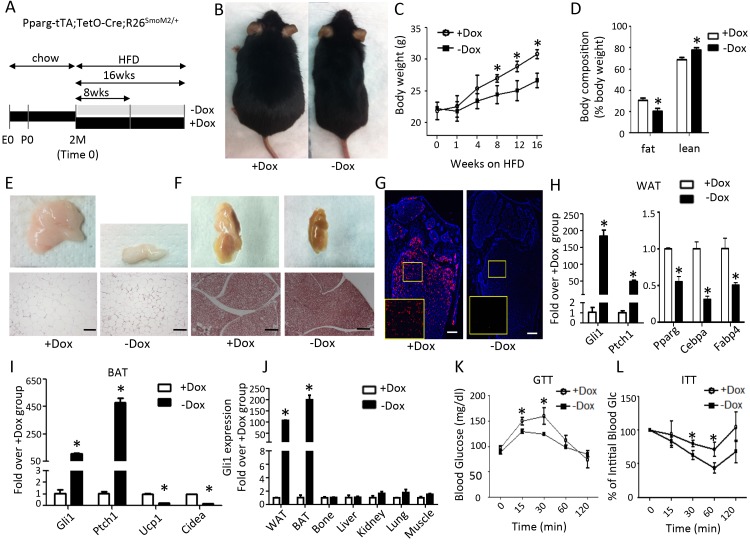
Figure 2. Smo activation prevents obesity and improves glucose metabolism in mice on high fat diet.
(A) A schematic for experimental design. (B) Representative images after 8 weeks on HFD. (C) Measurements of body weight. (D) Body composition after 8 weeks on HFD. (E, F) Whole-mount images (upper) and histology (lower) of gonadal white fat (E) or interscapular brown fat (F) after 8 weeks on HFD. (G) Detection of bone marrow fat by perilipin immunofluorescence staining after 8 weeks on HFD. Boxed regions shown at higher magnification in insets. (H, I) Gene expression by qPCR in WAT (H) and BAT (I) after 8 weeks on HFD. (J) Gli1 expression in different tissues after 8 weeks on HFD. (K, L) Glucose tolerance test (GTT) (K) and insulin tolerance test (ITT) (L) after 8 weeks on HFD. *p<0.05, n = 5 mice, females. Males show similar results. Black scale bar: 100 μm; white scale bar: 200 μm.
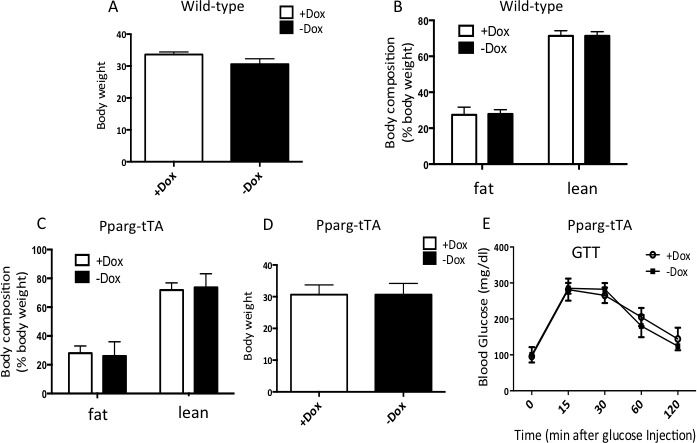
Figure 2—figure supplement 1. No obvious effect for Dox or Pparg-tTA alone on whole body metabolism.

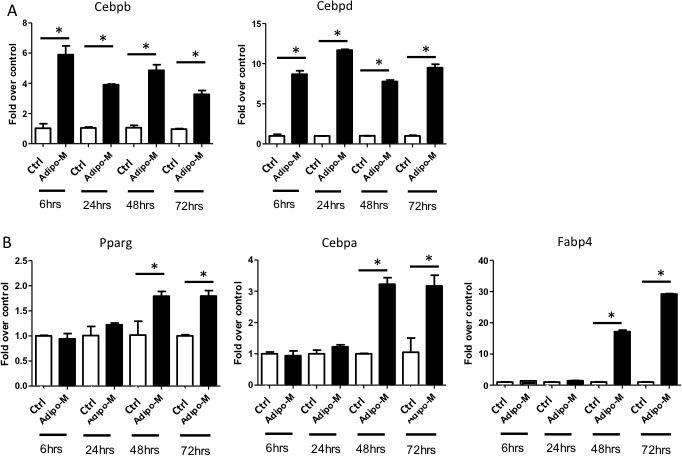
Figure 2—figure supplement 2. Characterization of adipogenesis in M2 cells.

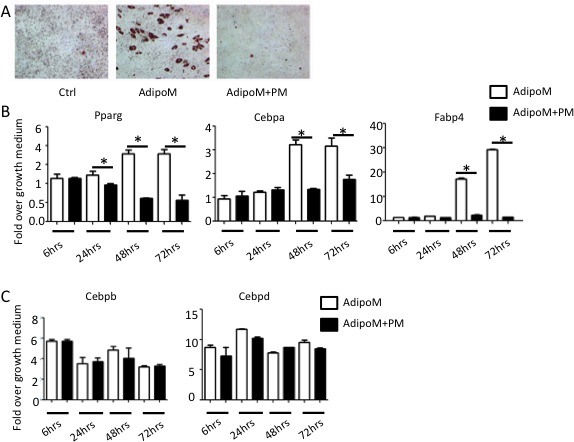
Figure 2—figure supplement 3. Hh signaling suppresses adipogenesis in M2 cells.


