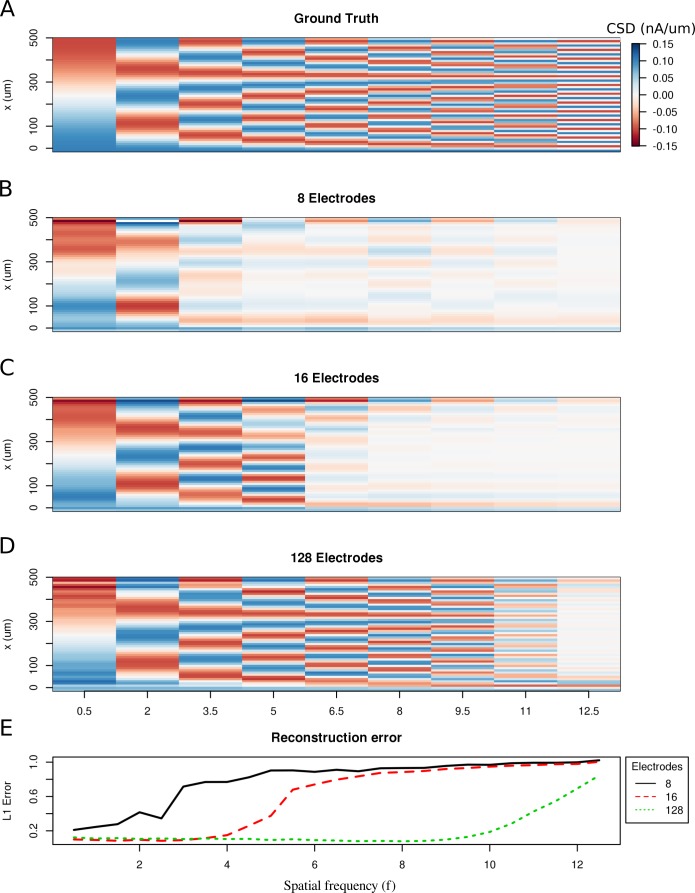
Figure 2. Limitations of the spatial resolution of the skCSD method in a simple ball-and-stick and laminar electrode setup.
(A) The ground truth membrane current source density distribution was constructed from cosine waves of increasing spatial frequency (x-axis) along the cell mophology (y-axis), which is shown in the interval representation. (B–D) skCSD reconstruction from 8, 16 and 128 electrodes. (E) The L1 Error of the skCSD reconstruction for 8 (black), 16 (red) and 128 (green) electrodes for CSD patterns of increasing frequency.

