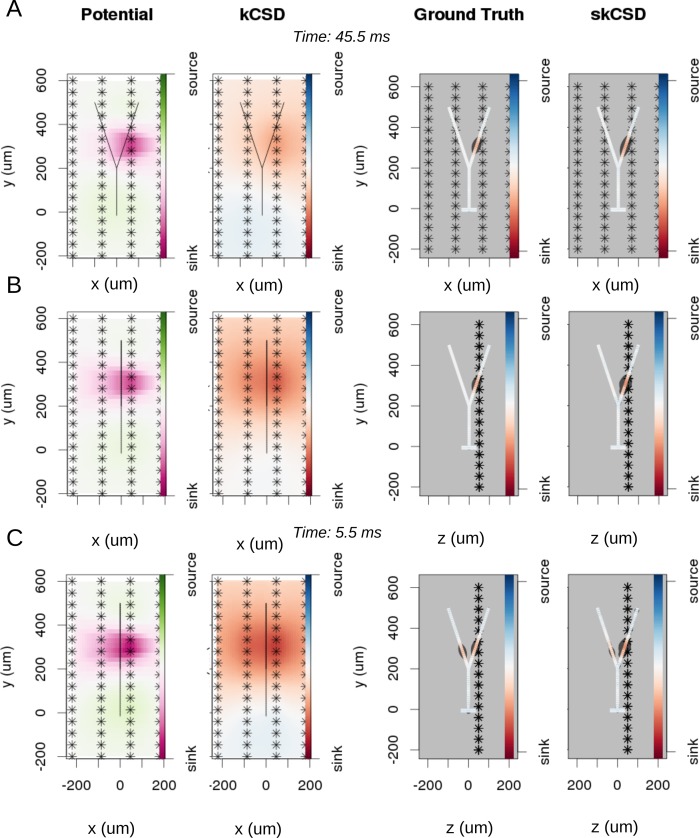
Figure 5. Reconstruction of synaptic inputs on a Y-shaped neuron with a regular rectangular 4 × 16 electrode grid.
Each panel (A–C) shows the spline-interpolated extracellular potential (V), followed by standard kCSD reconstruction, both at the plane of the 4 × 16 electrodes’ grid used for simulated measurement. Then, the ground truth and skCSD reconstruction are shown in the branching morphology representation in the plane containing the cell morphology. Each figure shows superimposed morphology of the cell. Note that in panel A the grid is parallel to the cell, while in panels (B–C) it is perpendicular. The dark gray shapes are guides for the eye and are sums of circles placed along the morphology with radius proportional to the amplitude of the sources at the center of the circle. (A) Shows results for a synaptic input depolarizing one branch. (B) Shows the same current distribution as in the previous setup, but the grid is rotated by 90 degrees. (C) A synaptic input is added to the other branch. Observe that in all three cases, the interpolated potential and the standard CSD reconstruction, which can be drawn only in the plane of the electrodes’ grid, do not differ significantly, hence they cannot distinguish between these three situations. On the other hand, skCSD method is able to identify correctly both synaptic inputs.

