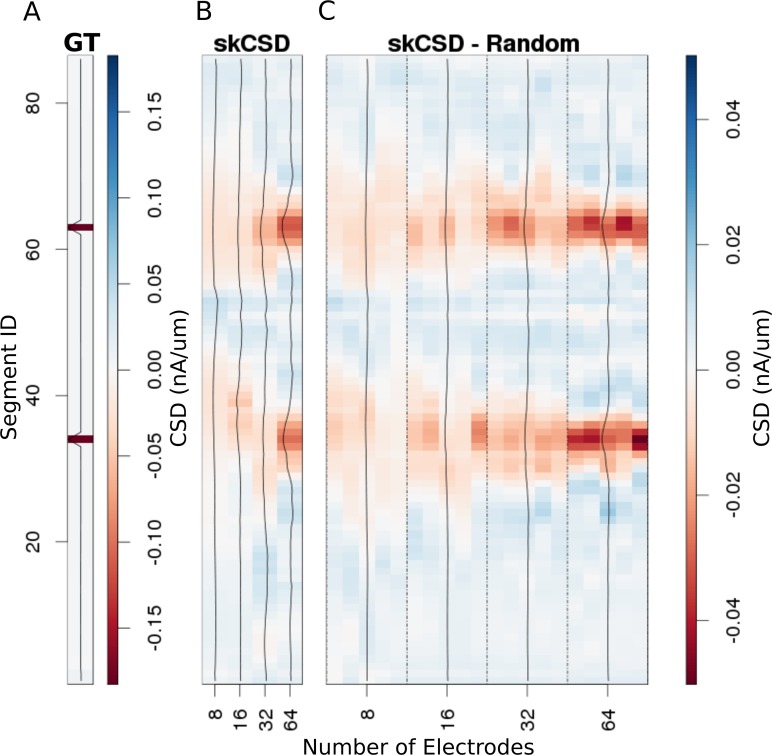
Figure 6. Reconstruction of synaptic inputs placed on different branches of the Y-shaped neuron for electrodes arranged regularly and randomly within the same area.
We use the interval representation for visualization. The numbers on horizontal axis enumerate different electrode setups. The black profiles show the averaged membrane current as reconstructed in a given case; for random electrode distribution these are averages over five different realizations. (A) Ground truth membrane currents, the strong red indicates the synaptic inputs. (B) Reconstruction results for 8 (4 × 2), 16 (4 × 4), 32 (4 × 8), and 64 (4 × 16) electrodes arranged regularly. The skCSD reconstruction improves with the number of electrodes as the color representation and the black profiles indicate. (C) When distributing the same numbers of electrodes on the same plane as in the previous case, the quality of the average skCSD reconstruction, as indicated by the black profiles, is similar.

