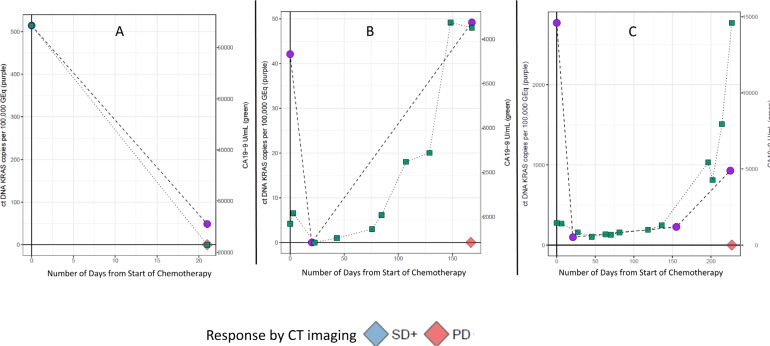
Figure 11. Discrepant predictive modeling plots.
Patient A had decreasing CA19-9 and ctDNA KRAS levels as compared to baseline, but a RECIST 1.1 assessment of progressive disease (PD) (A). Patient B had increasing CA19-9 and ctDNA KRAS as compared to baseline, but the difference between the baseline and longitudinal timepoints did not meet threshold for a PD call (B). In Patient C, there was a predicted response of stable disease response, and the longitudinal ctDNA KRAS was just below our threshold, thus this is a borderline case (C).

