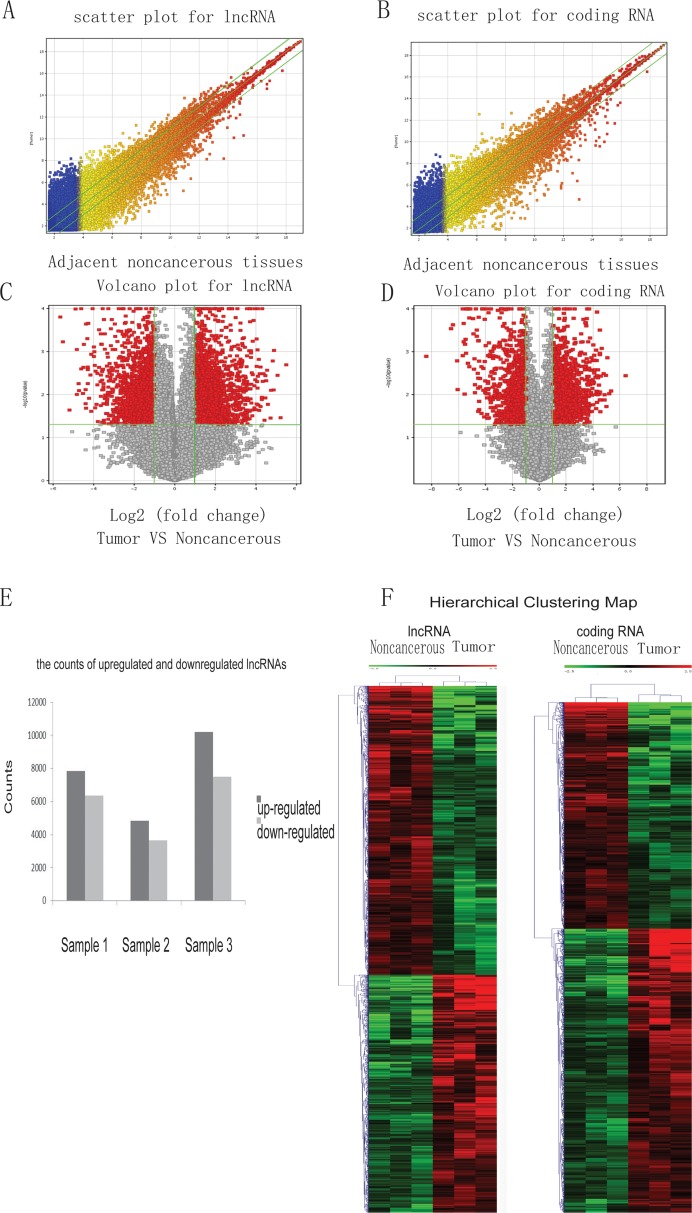
Figure 1. The expression profiles of lncRNA and coding genes in HCC and paired adjacent noncancerous samples.
Total RNA from 3 pairs of HCC and noncancerous samples was isolated to study gene expression using the human lncRNA microarray v4.0. A scatter plot was used to assess lncRNA (A) and coding gene RNA (B) expression reproducibility. The values on the x and y-axis of the scatter plot are the averaged normalized signal values of noncancerous and tumor tissue (log 2 scaled). Additionally, a volcano plot was used to analyze the differentially expressed lncRNAs (C) and coding genes (D) between noncancerous and cancer tissues. The red dots to the left and to the right of the vertical green lines indicate RNAs with a greater than 2.0-fold change and statistical significance (p-value < 0.05). (E) The counts of upregulated and downregulated lncRNAs in the three samples used in the microarray. (F) Hierarchical Clustering Map of abnormal lncRNA and coding RNA in HCC.

