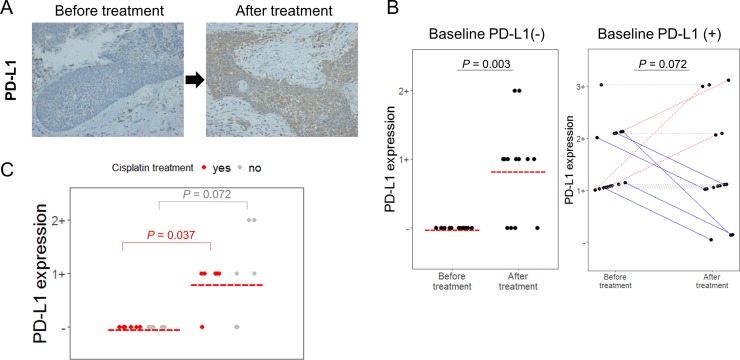
Figure 1. PD-L1 changed after treatment in HNSCC patient samples.
(A) Representative PD-L1 immunochemical staining (×400). PD-L1 expression was increased after treatment. (B) Changes in PD-L1 expressions before treatment (baseline) and after treatment in 35 HNSCC patients are shown. Each dot represents PD-L1 expression positivity, and red bar represented indicates PD-L1 expression positivity in each group. For the right side graph, each line connects the same individual. Red dash lines represent PD-L1 positivity is increased, while blue solid lines represents PD-L1 positivity is decreased. (C) Among baseline PD-L1-negative patients, PD-L1 positivity measured by immunohistochemistry was more significantly up-regulated in cisplatin-treated patients (red dot) compared to those who were not exposed to cisplatin (grey dot). P values were noted for comparison of before treatment (baseline) PD-L1 positivity and after treatment PD-L1 positivity in each group of cisplatin-treated patients (red) and cisplatin-naïve patients (grey).

