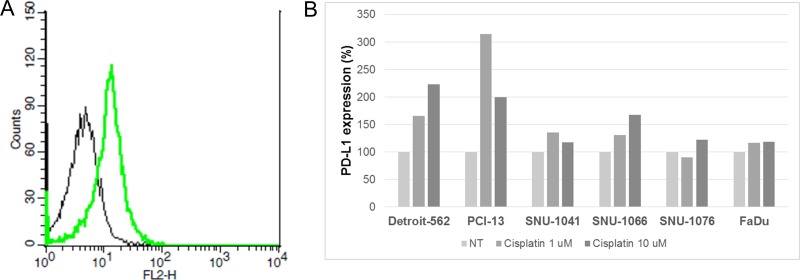
Figure 2. Increased PD-L1 expression by cisplatin treatment in HNSCC cells.
(A) Cisplatin 1 μM (green line) or normal saline (black line) was used to treat SNU-1041 cells for 24 h, and then flow cytometry analysis was performed using anti-PD-L1 antibody. PD-L1 expression was measured as the geometrical mean of fluorescence in gated cells. (B) Bar graph showing mean PD-L1 expressions according to cisplatin treatment in HNSCC cells. Each bar represents the percent change of PD-L1 expression compared to no treatment (NT) in each HNSCC cell line.

