
Figure 5. Mapping of the binding regions between TSC-22 and CSF-1R.
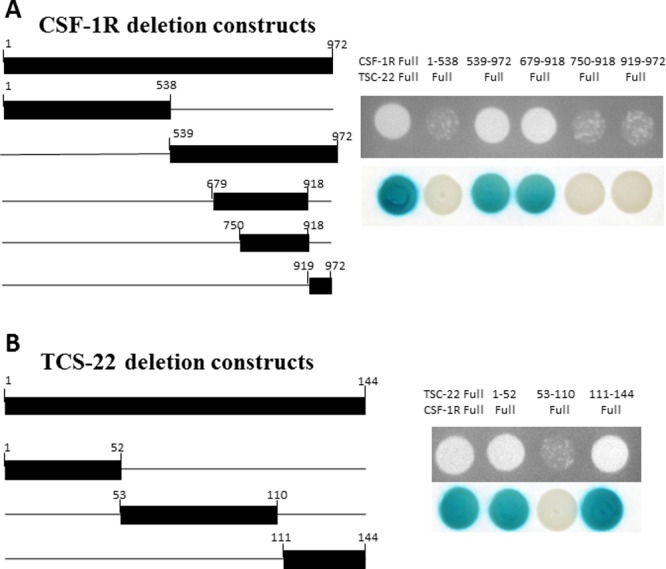
Left schematic diagram displays the cDNA deletion constructs of CSF-1R and TSC-22. Right panel shows the results of protein-protein interaction using growth and β-galactosidase assays. Positive transformants are indicated by the formation of colonies on the plate.