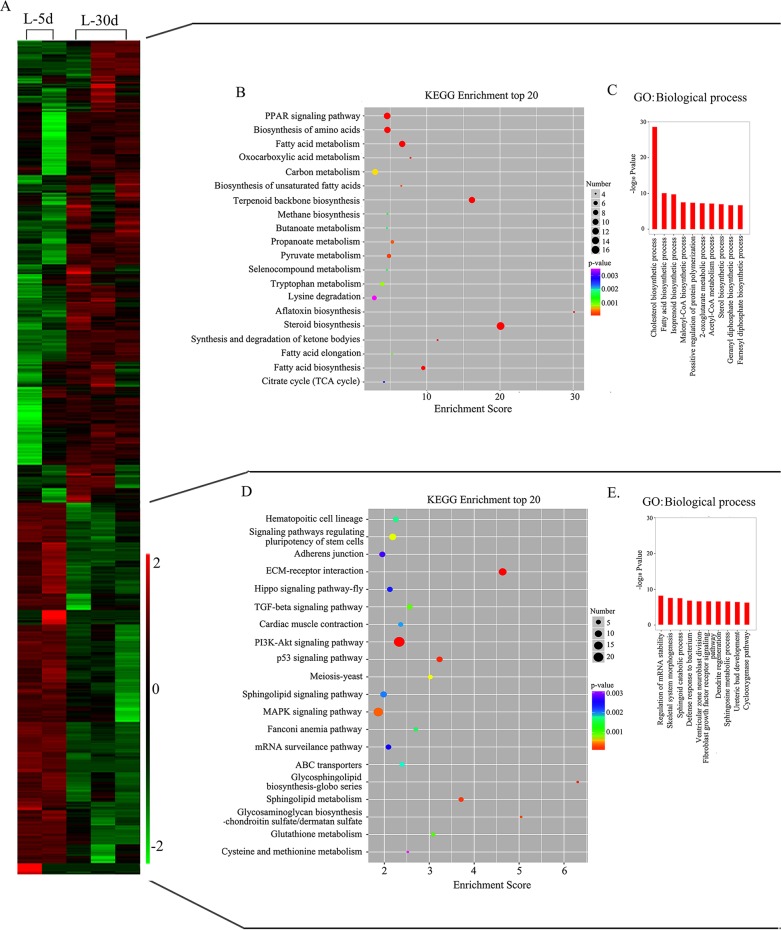
Figure 2. Mammary gland gene expression profile at L-5 d and L-30 d with differentially enriched canonical functions related to lactation process at L-30 d.
(A) Heat map for the gene expression profile. (B) KEGG pathway analysis for up-regulated genes at L-30 d. (C) Biological process in GO enrichment for up-regulated genes at L-30 d. (D) KEGG pathway analysis for down-regulated genes at L-30 d. (E) Biological process in GO enrichment for down-regulated genes at L-30 d.

