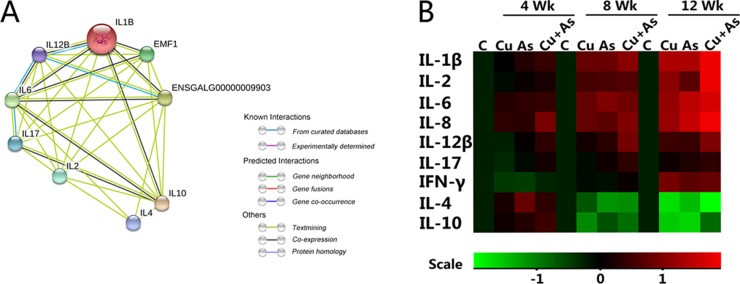
Figure 5. Protein network analysis and mRNA levels of immune-related genes.
(A) Protein network of proteins regulated between immune-related genes. (B) The heatmap of mRNA expression levels of immune-related genes. Values were expressed as mean ± SD. Symbol for the signifcance of differences between the transport group and control group: *P < 0.05, **P < 0.01. The mRNA expression levels of genes transcription are shown using the indicated pseudo color scale from -1 (green) to +1 (red) relative to values for control group. The color scale represents the relative mRNA expression levels, with red indicating up-regulated genes, green indicating down-regulated genes.

