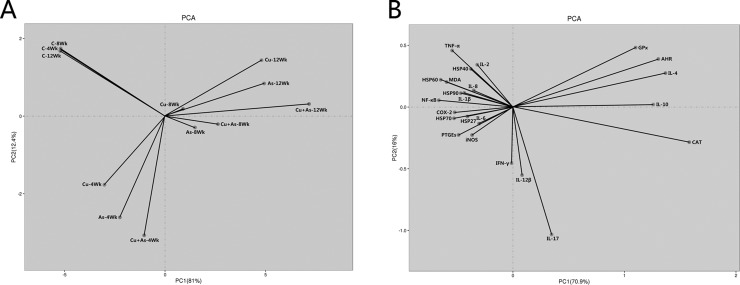
Figure 7. Ordination diagram of PCA for the parameters that were measured in the chicken kidney.
(A) Ordination diagram of PCA of groups measured in chicken kidney overexposed to CuSO4 or/and As2O3. (B) Ordination diagram of PCA of parameters measured in chicken kidney overexposed to CuSO4 or/and As2O3.

