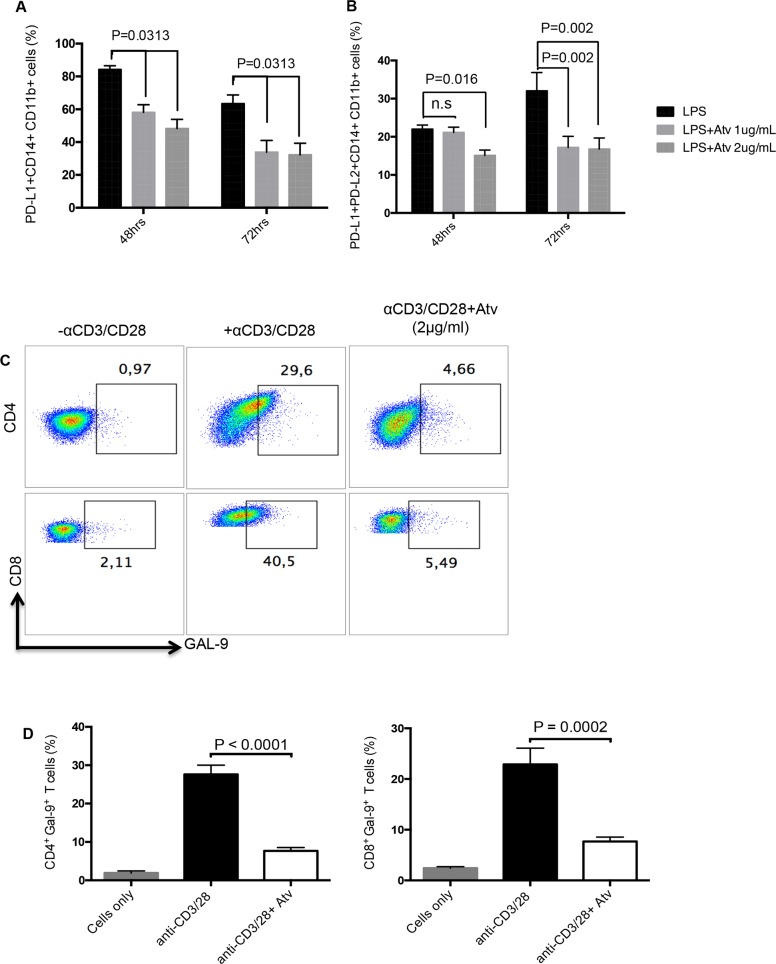
Figure 5. Expression of co-inhibitory receptor ligands are reduced in response to atorvastatin treatment.
(A) Bar graphs showing expression of PD-L1 by CD11b+CD14+ monocytes from LPS-stimulated cultures in the presence of atorvastatin (1 or 2 μg/ml) for 48 and 72hrs. (B) Bar graphs showing co-expression of PD-L1 and PD-L2 by CD11b+CD14+ monocytes from LPS-stimulated and atorvastatin-treated (1 or 2μg/ml) cultures at 48 and 72hrs. (C) Representative dot plots showing expression of Gal-9 by CD4+ or CD8+ T cells from α-CD3/CD28-stimulated cultures alone, or in the presence of atorvastatin (2 μg/ml) for 48hrs. (D) Bar graphs showing expression of Gal-9 by CD4+ (right) and CD8+ (left) T cells from α-CD3/CD28-stimulated cultures, with or without atorvastatin (2 μg/ml). Results are representative of three independent experiments. Bar, mean ± one standard error.

