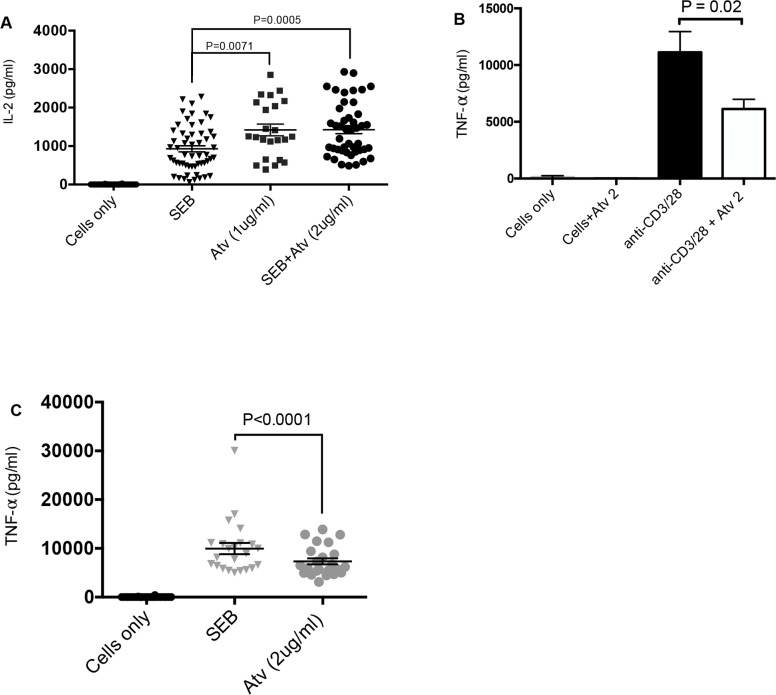
Figure 6. Cytokine production by stimulated PBMCs in response to atorvastatin treatment.
(A) Scatter plots with bars showing concentration of IL-2 in cell culture supernatants from unstimulated, SEB-stimulated and stimulated PBMCs in the presence and/or absence of atorvastatin (1 or 2 μg/ml). (B) and (C) Bar graph and scatter plot showing concentration of TNF-α in cell culture supernatants stimulated by α-CD3/CD28 and SEB with or without atorvastatin treatment. Bar, mean ± one standard error. Each point represents data from an individual PBMC, representative of more than three independent experiments.

