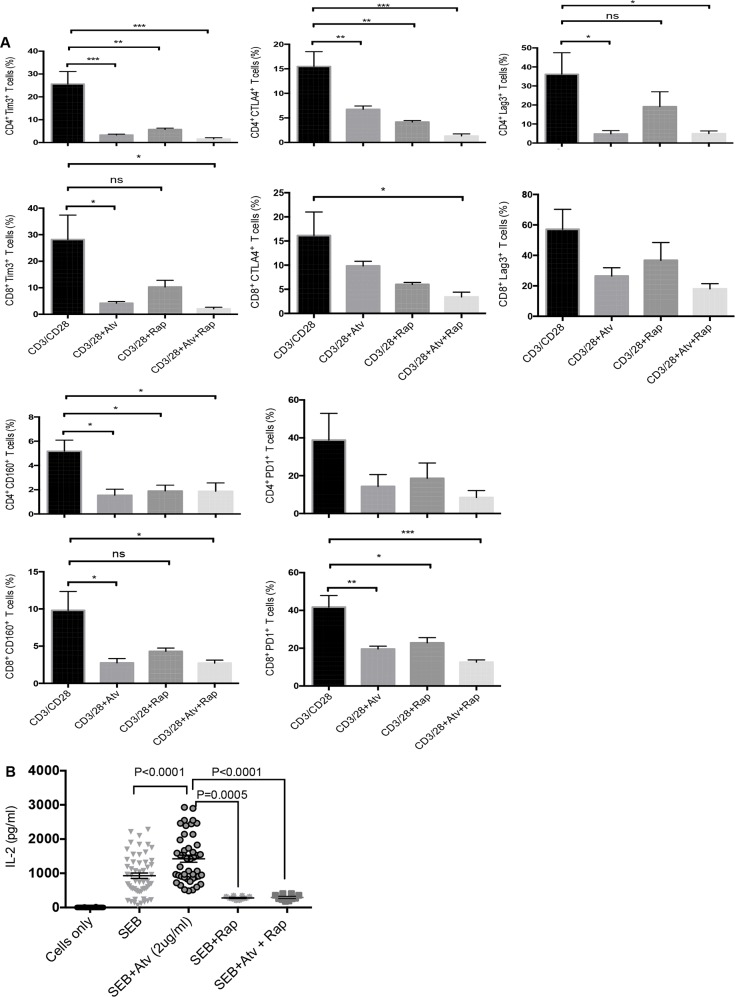
Figure 9. Co-inhibitory receptor expression and IL-2 production in response to atorvastatin and rapamycin treatment.
(A) Bar graphs showing expression of indicated co-inhibitory receptors by CD4+ and CD8+ T cells stimulated with α-CD3/CD28 and treated with atorvastatin, with or without rapamycin (100nM). (B) Scatter plots showing IL-2 production in response to SEB stimulation with or without atorvastatin and/or rapamycin treatment. Data from three independent experiments shown. Bar, mean ± one standard error. P values are defined by * (P ≤ 0.05) ** (P < 0.01) and *** (P < 0.001).

