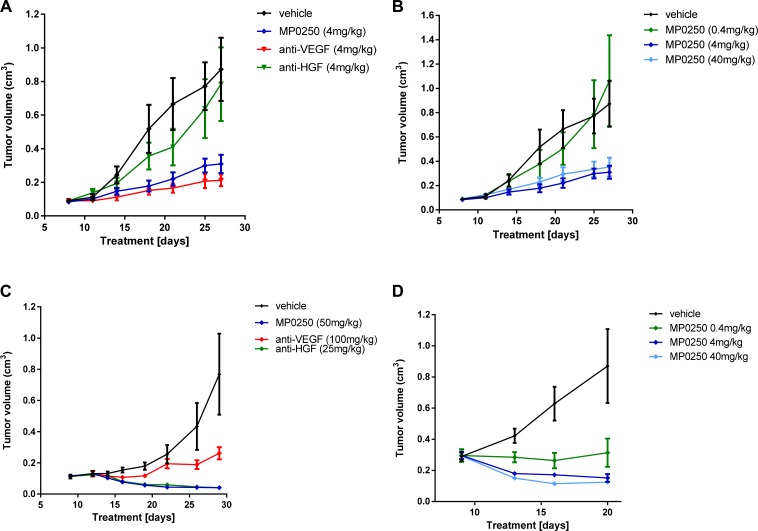
Figure 2. Tumor growth inhibition in U87MG and A673 xenograft models.
Tumor growth inhibition in the A673 rhabdomyosarcoma xenograft model (A, B) and the U87MG glioblastoma model (C, D). Figures 2A and 2C show the anti-tumor response to MP0250, the anti-HGF DARPin® molecule and the anti-VEGF DARPin® molecule. Figure 2B and 2D show a dose response of MP0250. Tumor growth is plotted as mean +/- SEM.

