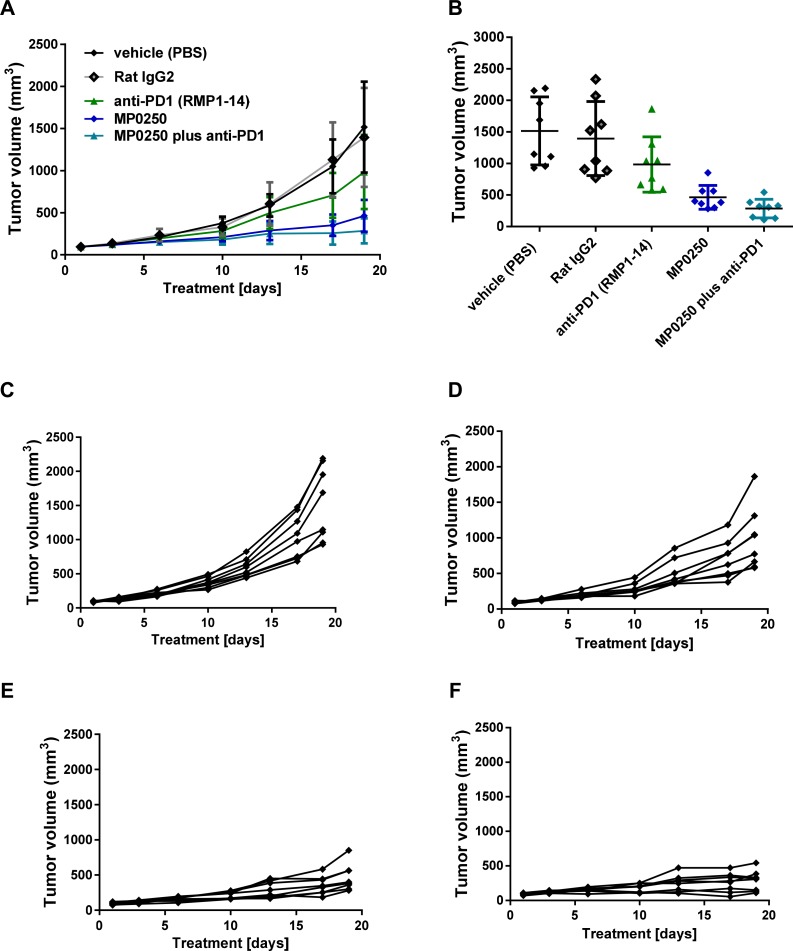
Figure 6. Tumor growth inhibition by MP0250 in combination with anti-PD1.
MC38 tumor cells were implanted into C57/Bl6 mice. Mice were randomized into 5 groups of 8 mice. MP0250 was dosed at 4 mg/kg 3x weekly (i.v.); anti-PD1 antibody RMP1-14 was dosed at 5 mg/kg 3x weekly (i.p.). (A) shows the growth curve of the anti-tumor response, (B) shows the tumor volume at the end of the study. Tumor growth is plotted as mean +/- SEM. (C-F) shows the tumor growth curves of the individual animals; (C) shows the vehicle group, (D) the RMP1-14 treatment group, (E) the MP0250 treatment group and (F) the MP0250/RMP1-14 combination group.

